Summary
One of the key goals of Sedai’s autonomous cloud management platform is to maximize application availability. AWS Lambda is launching the new Telemetry API, and as a launch partner Sedai uses Telemetry API capabilities to provide additional insights and signals to help improve the availability of customers’ Lambda functions.
Overview of AWS’s New Telemetry API
The new Lambda Telemetry API enables AWS users to integrate monitoring and observability tools with their Lambda functions. AWS customers and the serverless community can use this API to receive telemetry streams from the Lambda service, including function and extension logs, as well as events, traces, and metrics coming from the Lambda platform itself.

Sedai's Use Case for the new AWS Telemetry API
Sedai uses the Telemetry API to help improve Lambda performance and availability for our customers. We see two related use cases for the new capability:
- Enhanced manual remediation. Troubleshooting is improved as the new Telemetry API allows us to pull out key execution data for errors (i.e., problematic invocations), and share that in our product UI to help customer resolve issues that cannot be addressed autonomously.
- Enhanced autonomous remediation. The Telemetry AI provides new signals for our ML models. We are working on providing additional signals in our ML models building on the new metrics & spans and log data available in the Telemetry API to help inform availability & optimization recommendations.
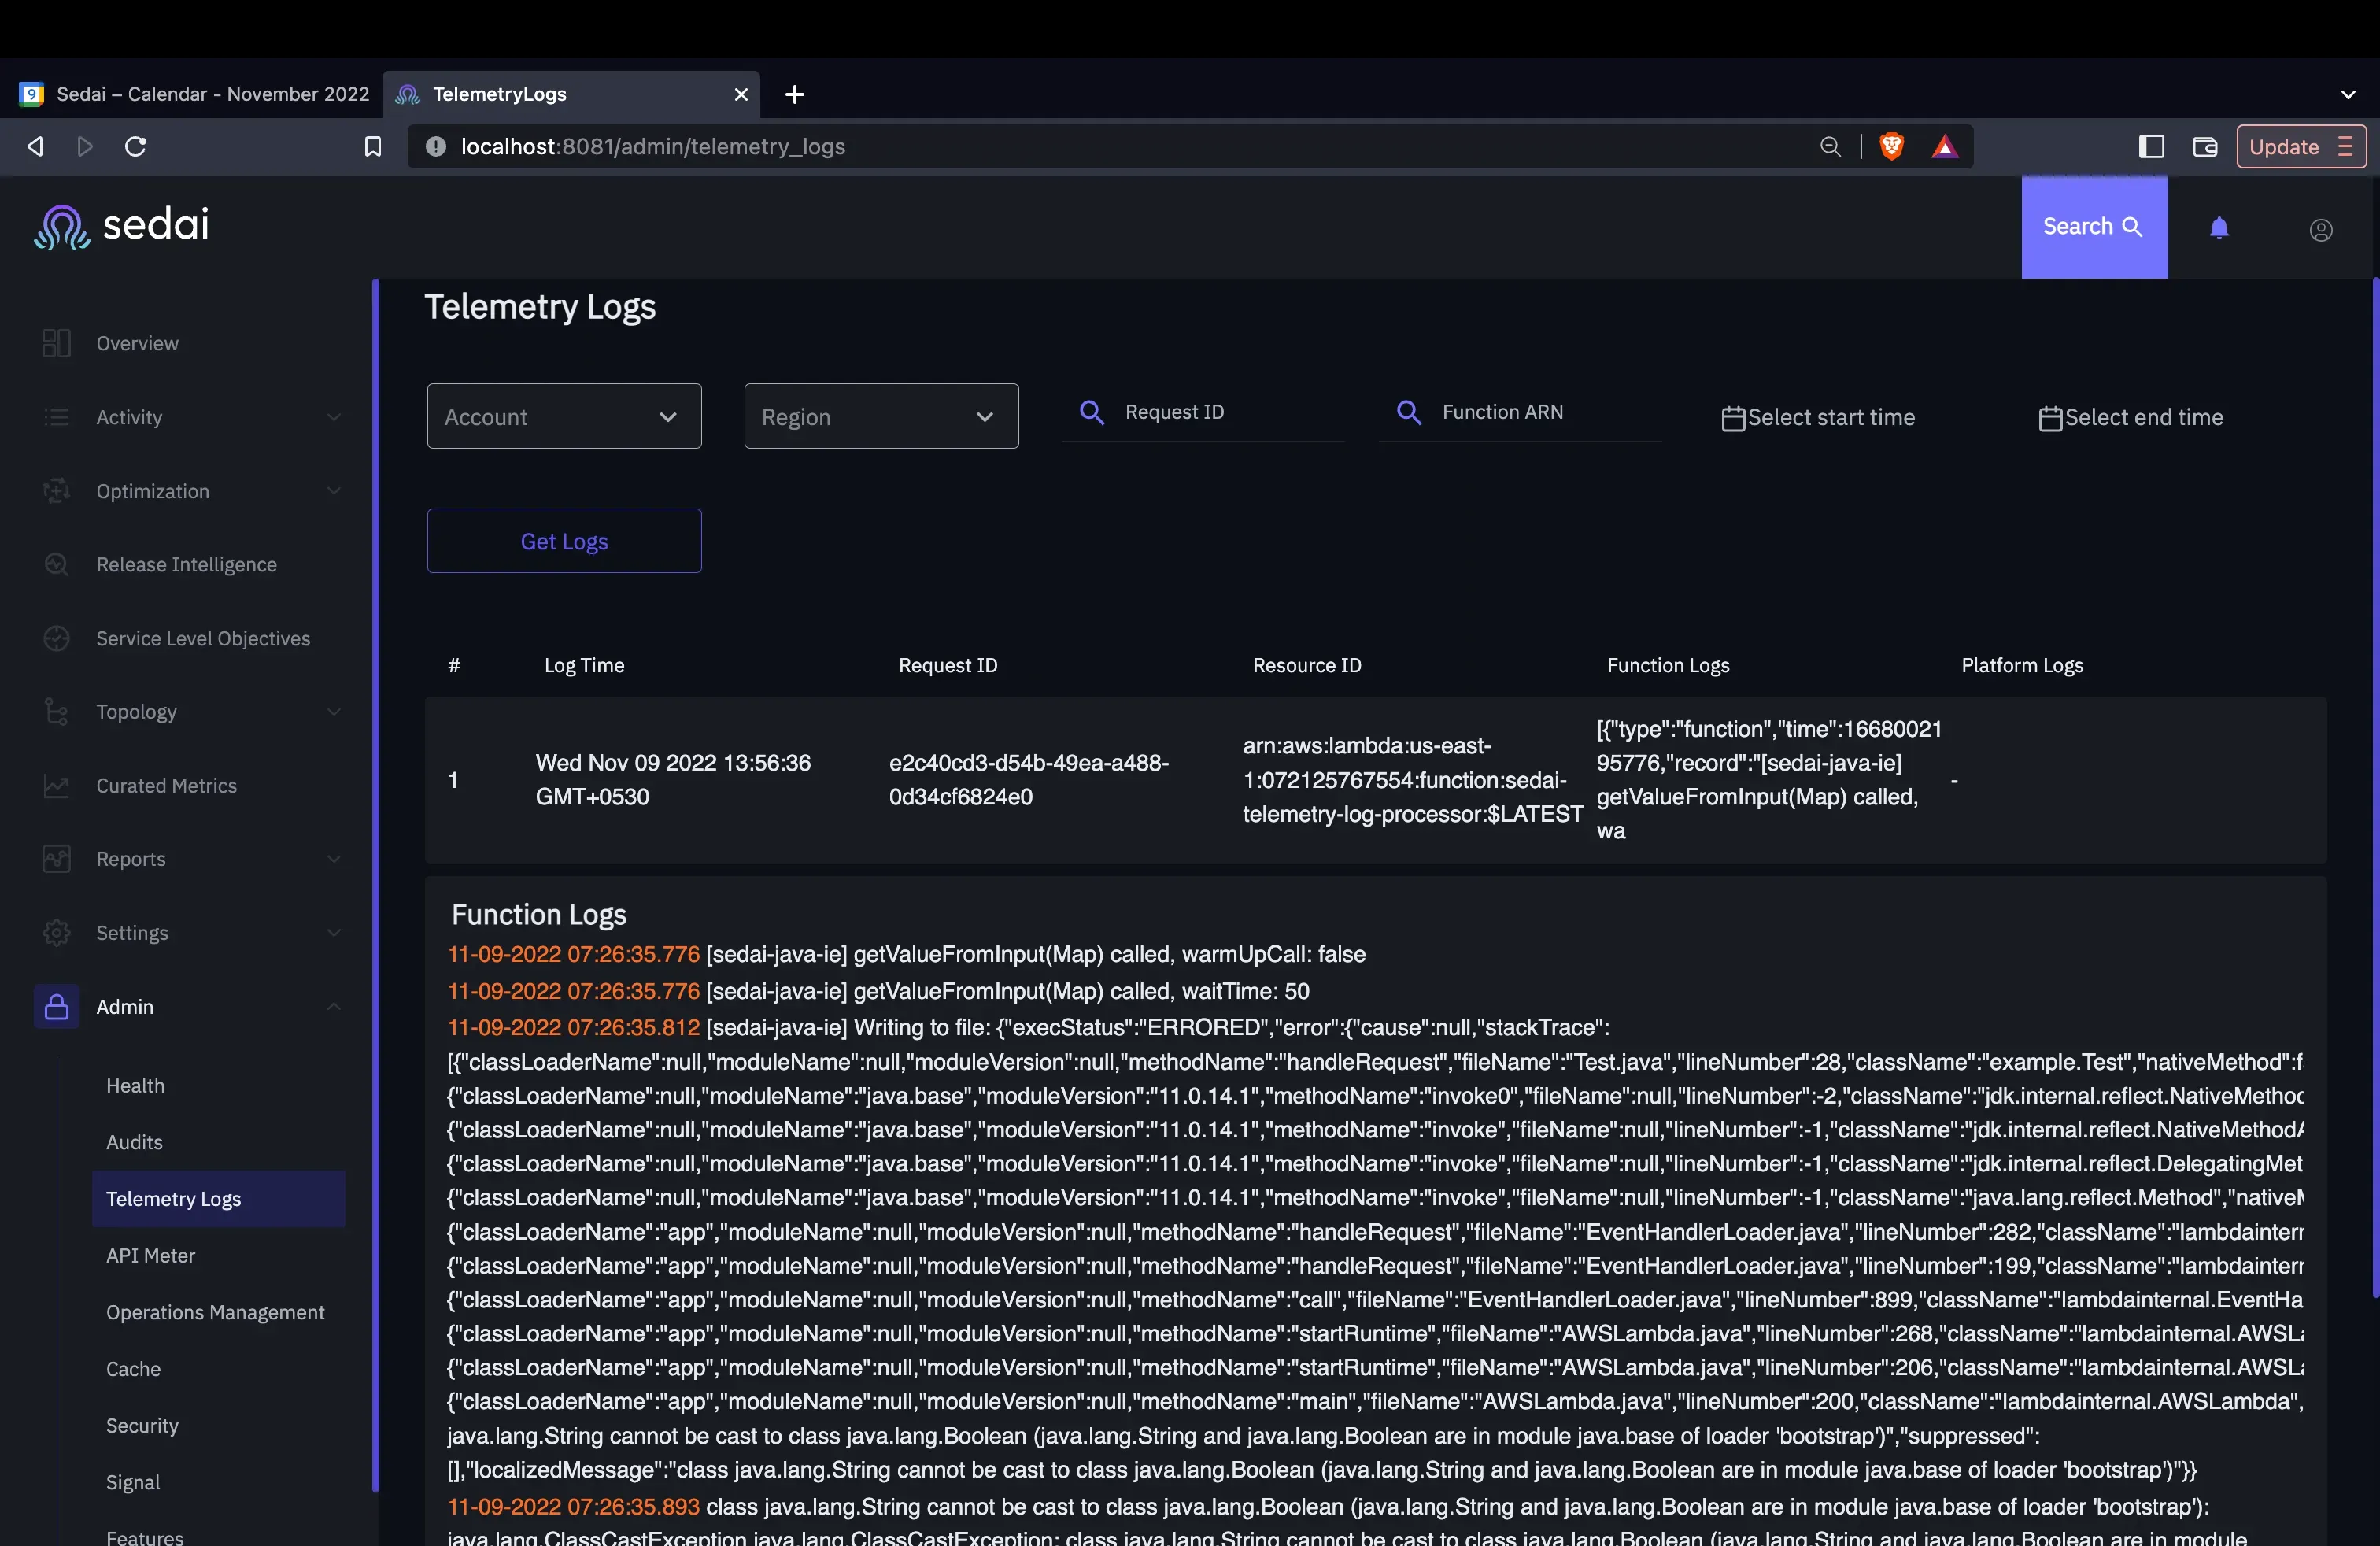
When the Lambda function is running, the function generates the logs. The logs are available to a custom extension that we wrote than runs alongside the function. We can see a lot of useful information from the log about the runtime such as:
- exact execution time
- details of a request
- what is the response
- if a cold start occurred
- whether the function errored out
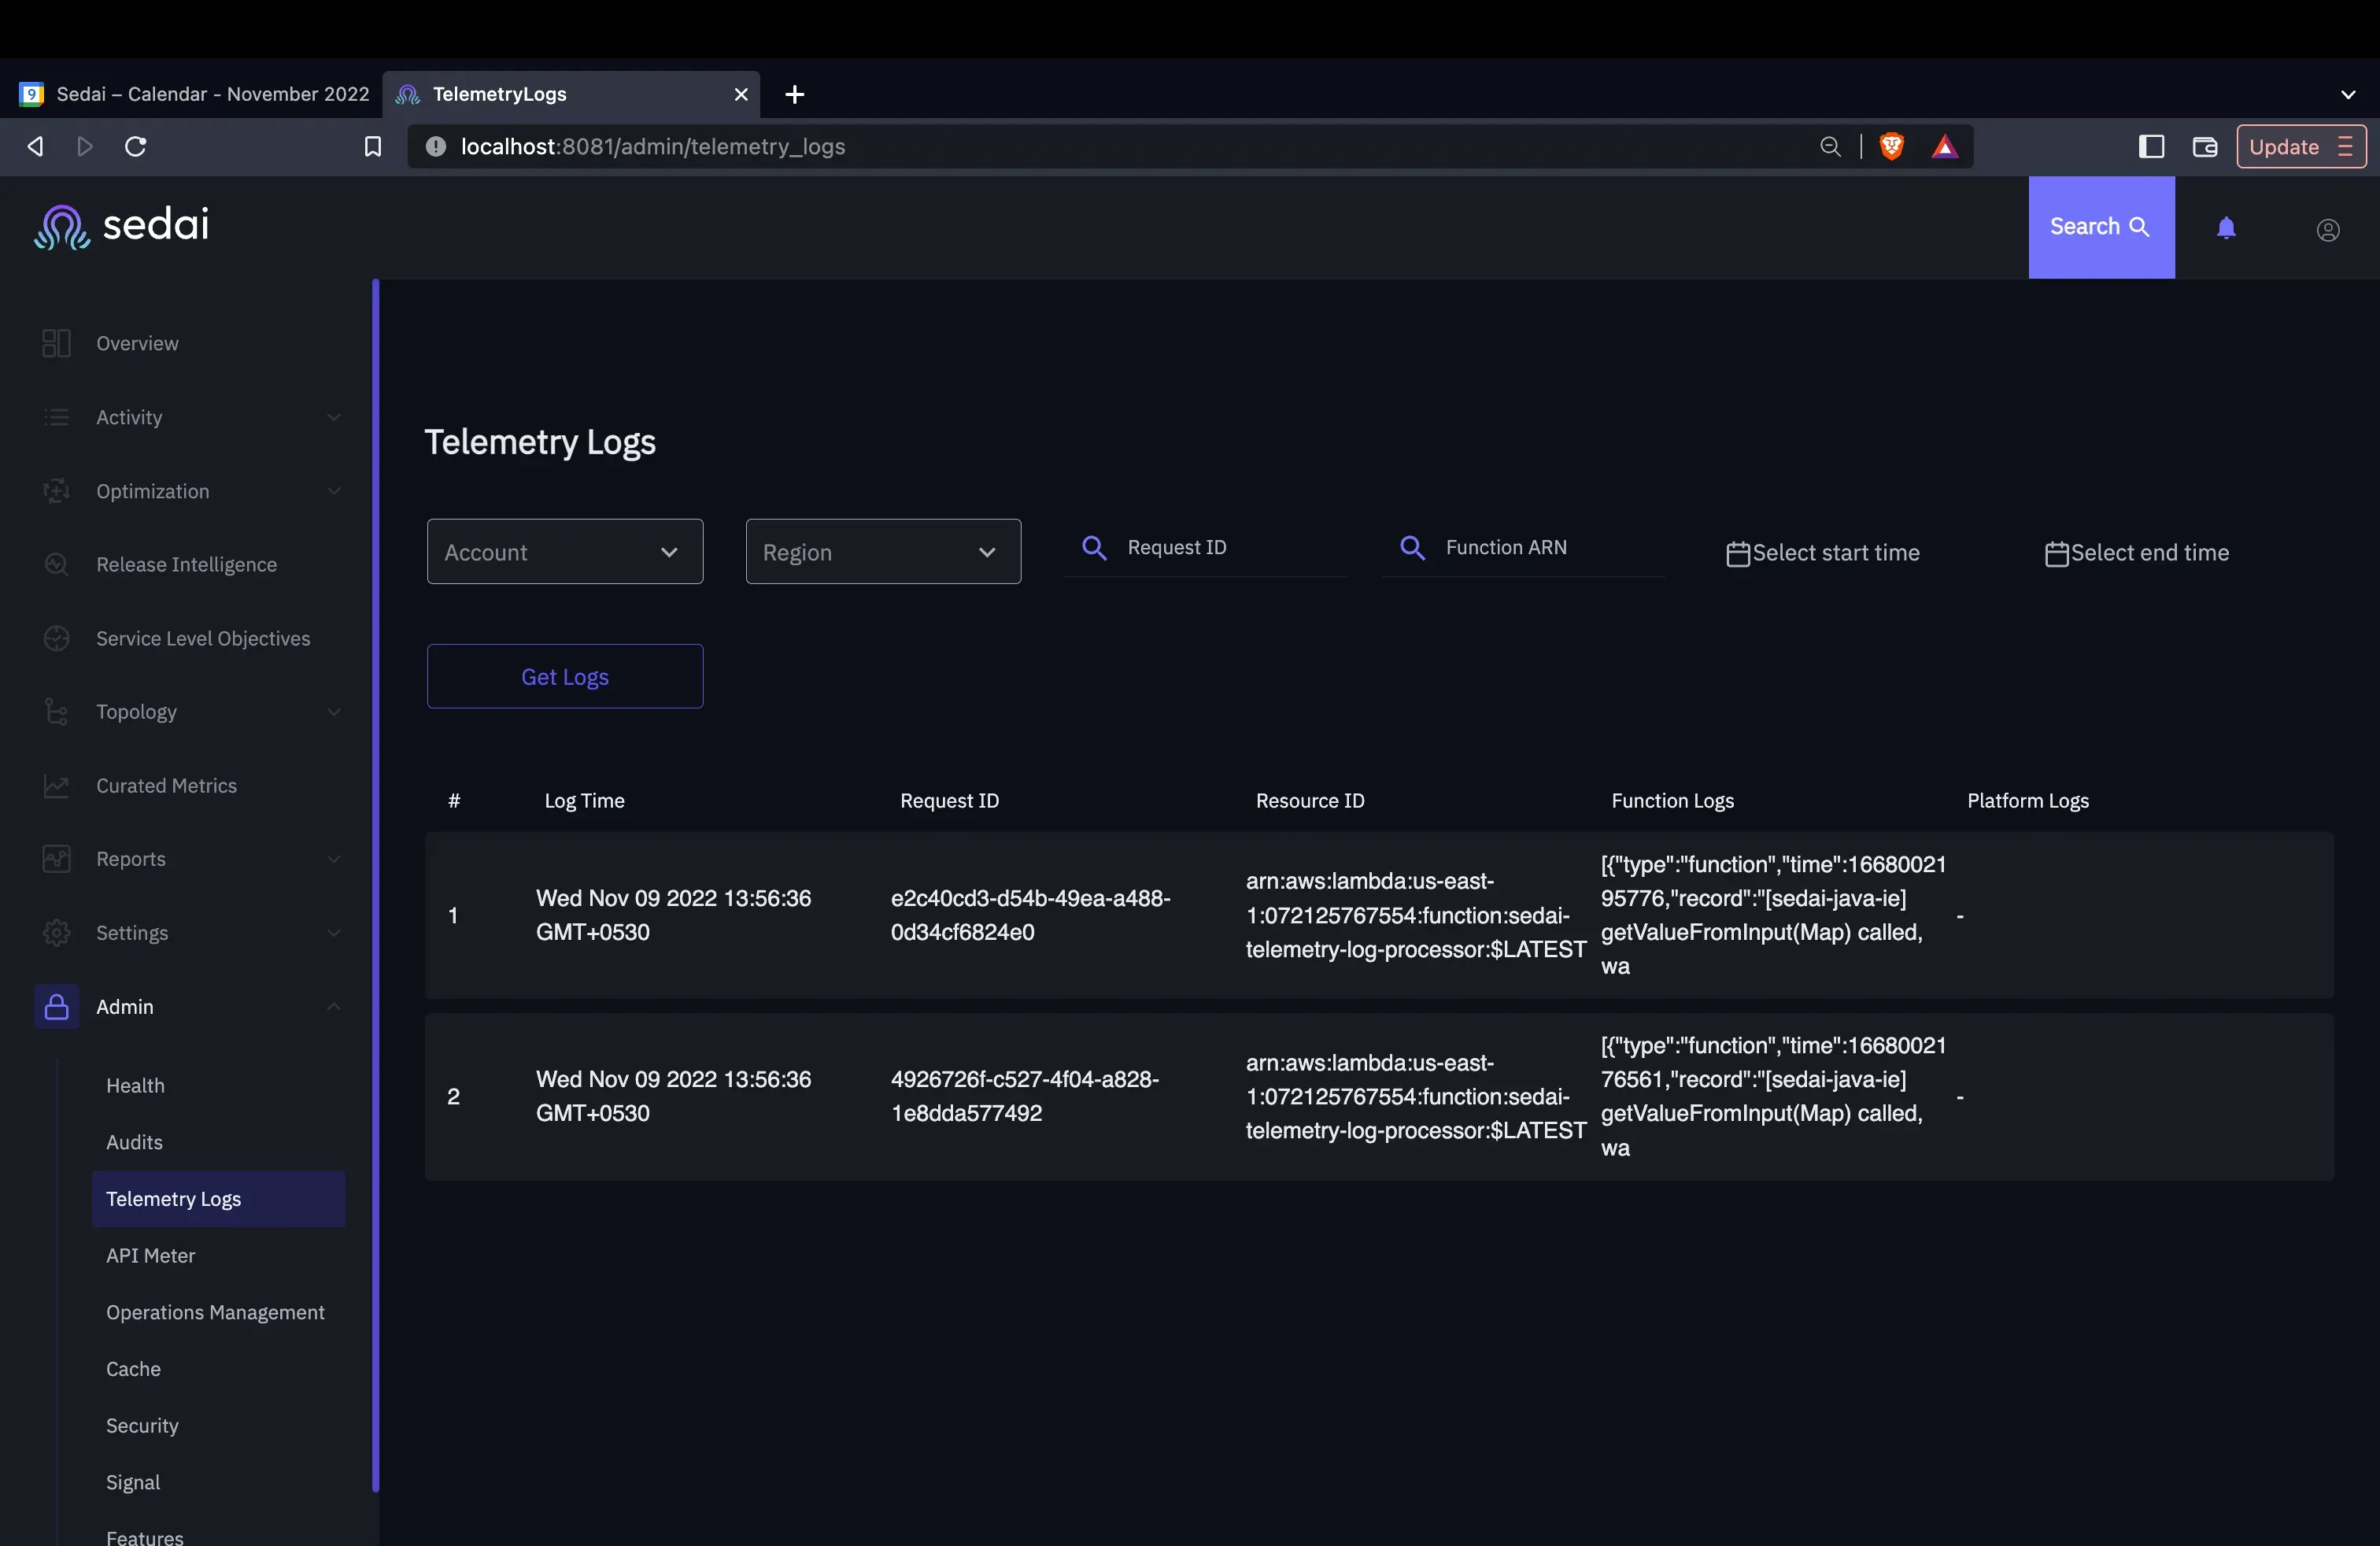
Below is an example inside the Sedai platform of logs captured and an example of the detailed error information that can be accessed:


We also see additional use cases over time for the Telemetry API as a flexible source of monitoring data.
Benefits for Our Customers
Top benefits for Sedai customers:
- Improved availability. Sedai’s serverless customers can identify and address root causes through faster manual or autonomous remediation, helping reduce Lambda error rates and FCIs (Failed Customer Interactions) including critical services such as ecommerce payments.
- Reduced product operating costs. We are able to manage the costs of product delivery as the new Telemetry API offers insights in a simple and unified way versus using disparate tracing sources. Capturing all tracing data would have been cost-prohibitive. Note there is an indirect cost for usage of the Telemetry API as the new extension may add perhaps a few milliseconds of Lambda usage, though not impacting the actual execution time of the underlying code in the Lambda itself. We are able to share these benefits with our customers through lower prices.
- We are able to manage the costs of product delivery as the new Telemetry API offers insights in a simple and unified way versus using disparate tracing sources.
Benefits for Our Engineering Team
From the perspective of our internal engineering team directly using the Telemetry API we have also seen three major benefits:
- Simplified instrumentation: by making logs, platform traces, and platform metrics available directly to the Extension, Telemetry API has made it easier for Sedai to obtain the data we need without having to build any complex instrumentation or deploy additional libraries.
- Enhanced observability: the Telemetry API provides deeper insights into the different phases of the Lambda execution environment lifecycle (initialization, invocation, etc.) which help us offer enhanced insights to our customers. These insights include better cold start visibility (through events related to init phase), understanding whether initialization happened normally (during init phase) or during invoke phase due to timeout/reset (through “phase” field on the init events).
- Access to new metrics and spans: New metrics such as durationMs on the platform.runtimeDone event provide the time taken by Lambda Runtime to execute our customer’s code in the function handler. This helps us isolate the time taken by Extension (if any) to run after the Runtime was done running the code in the function handler. There are also 2 new spans on the platform.runtimeDone event — responseLatency and responseDuration.
Availability
Sedai’s serverless platform using the Telemetry API is available now globally for x86-compatible serverless functions. Sign up at app.sedai.io/signup or request a demo at sedai.io. To learn more about the feature read AWS's launch blog here.
