Sedai raises $20 million for the first self-driving cloud!
Read Press Release

Attend a Live Product Tour to see Sedai in action.

Register now
More
Close

Software Performance Optimization: The Expert Guide for 2025

Last updated

June 17, 2025

Published
Topics
Last updated

June 17, 2025

Published
Topics
No items found.
Software Performance Optimization: The Expert Guide for 2025

We don’t need to convince you that it’s helpful to optimize your software’s performance. The result is lower costs, less latency, and probably a pat on the back from your boss.

But you’re busy. And chances are, you’ve got a lot of applications you’re responsible for. That’s why we created this expert guide to quickly make sure your software runs well, along with recommendations for how to reach the next level of optimization, using AI.

Impact on User Experience

When your app slows down, users bounce. You already know performance isn't just a tech issue; it's a business risk. But, there is a slight change since not all workloads are same. Real-time transactions, batch jobs, and API calls each have a different performance threshold. What works for one may not work for another.

Performance That Hits the Bottom Line

Amazon famously discovered that a 100ms delay in page load times caused a 1% drop in revenue. That’s not a rounding error; it’s millions of dollars. And it’s proof that latency is expensive.

If you’re running e-commerce or customer-facing apps, you’ve felt this. Slow pages mean lost carts. Hesitations mean lower conversions. The customer doesn’t wait; they just leave.

Here’s what that means for you:

  • Latency must be a monitored and enforced SLO.

  • Performance tuning can’t be static,  it has to adjust to usage patterns.

  • Every millisecond matters when dollars are on the line.

Amazon’s example isn’t extreme. It’s the new normal. Even when you're scaling up for a flash sale or throttling background processes to save cost, performance has to align with real-time demand.

The New Pressure from AI Apps

AI has raised the bar. Today’s users expect instant answers from LLMs, not spinning loaders. If your system can't keep up, they won't stick around.

Here’s what you’re up against:

  • LLM-powered features that require sub-second response times

  • Spiky, unpredictable workloads that make traditional tuning irrelevant

  • Complex user journeys that combine search, prediction, and real-time personalization

Performance now has to be smart, not just fast. That’s where AI-driven optimization tools come in. They don’t just flag slow endpoints; they predict and prevent them. Think real-time monitoring that doesn’t just observe but acts.

You can use AI to:

  • Automatically detect and fix bottlenecks before they affect users

  • Prioritize performance tuning based on real-world usage patterns

  • Maintain SLOs without over-provisioning or blowing your budget

Sedai takes it a step further. It’s the world’s first self-driving cloud, continuously adjusting and optimizing your resources in real-time. No more waiting for slow endpoints to catch up, Sedai acts before the problem even hits.

Bottom line: if you're not proactively tuning for both performance and cost, you're already falling behind.

Next: Let’s examine how autonomous systems are changing the game for performance optimization across the DevOps lifecycle and why manual tuning is no longer enough.

What Really Drives Software Performance And How to Own It
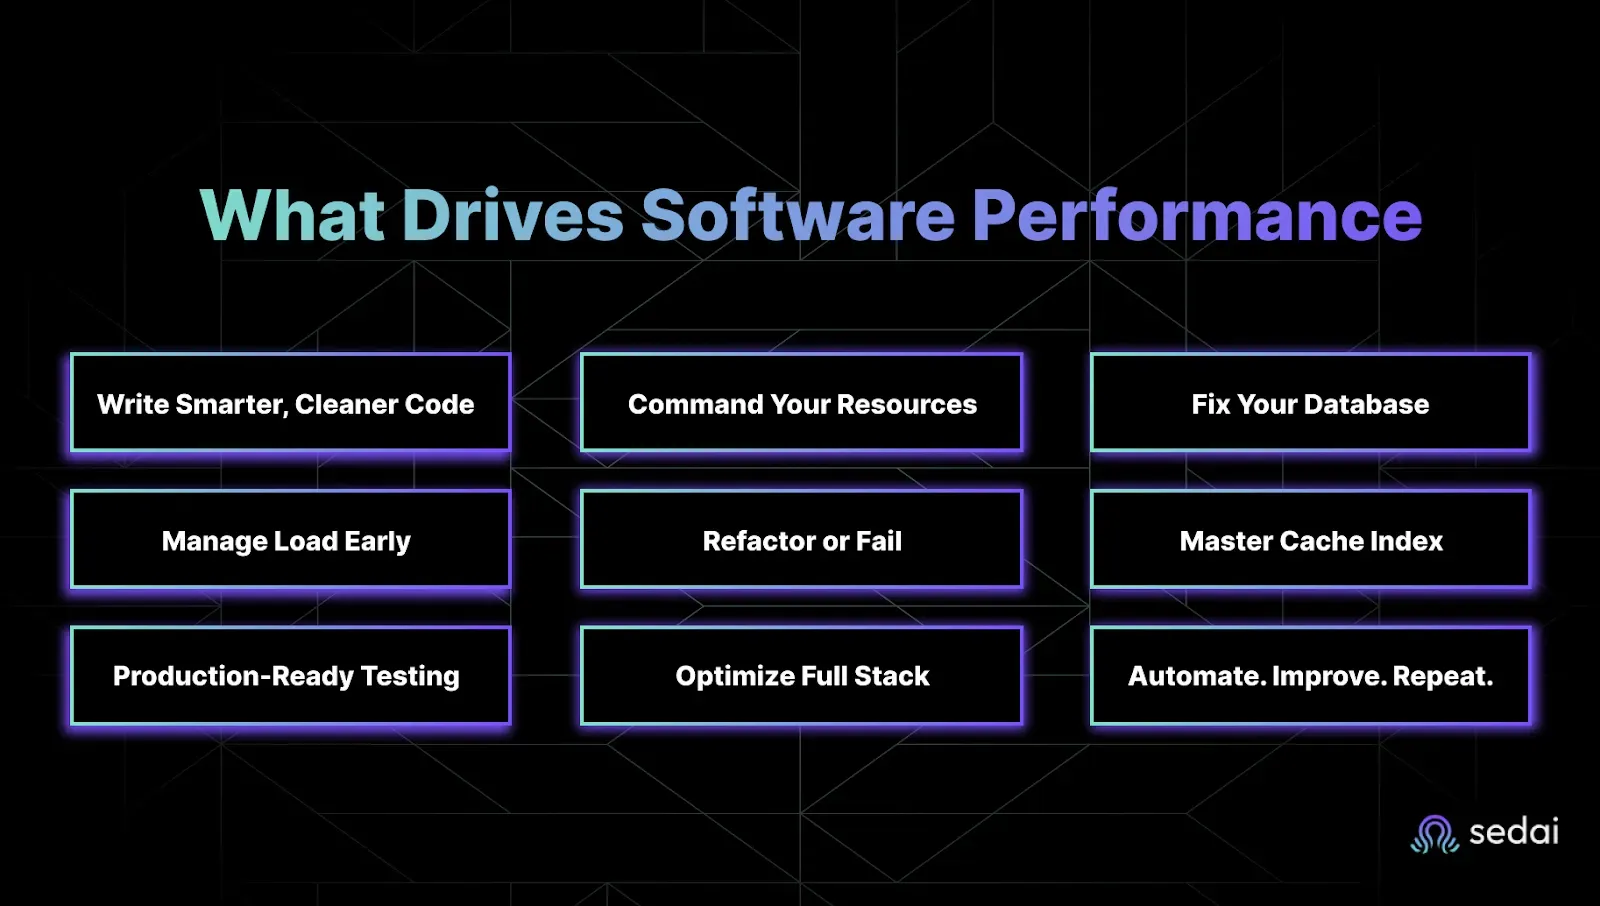
Performance isn't just about speed; it's about stability under pressure. It’s about keeping your latency SLOs green, your cloud bill under control, and your team out of excess workload mode.

Yet performance bottlenecks continue to appear in the same painful places through bloated code, inefficient database queries, and surprise traffic spikes your infrastructure wasn’t ready for.

Let’s break down the real drivers of performance and where you can take action before your next incident.

1. Write Smarter, Cleaner Code

The cleaner and more efficient your code is, the faster your app runs. Sounds obvious, but teams still underestimate how much latency comes from things like:

  • Poor algorithm selection

  • Redundant logic

  • Unoptimized loops

  • Complex call stacks

If you’re chasing tight latency SLOs, every millisecond matters. Focus on simplicity and speed, not cleverness.

Next step: Start using profiling tools to spot the slowest lines of your code. Don't guess, measure.

2. Master Your Resource Management

Overprovisioning is expensive. Underprovisioning is a support ticket waiting to happen. CPU, memory, and network throughput need to be tuned in real time. You can’t afford static configs in a dynamic system.

Tools like AWS Auto Scaling or Kubernetes HPA let you adjust based on live metrics, not gut feeling.

Performance tip: Set up dynamic thresholds for scaling, and use AI/ML to fine-tune based on real usage patterns. That’s where autonomous optimization shines.

3. Fix Your Database 

A slow query will kill your performance faster than a failing pod. The database is often the silent killer. If you're seeing latency spikes, check for:

  • Missing indexes

  • Expensive joins

  • Poorly cached queries

Quick wins:

  • Use Redis or Memcached for hot data

  • Run query analysis on your top 10 endpoints

  • Add indexing to high-read columns

Your app is only as fast as your worst query.

4. Balance the Load Before It Breaks You

No single server should carry the whole weight. Load balancers (like NGINX, HAProxy, or AWS ELB) spread traffic so there isn’t a single point of failure or meltdown.

Smart load distribution avoids throttling and gives you headroom when traffic surges.

What to check:

  • Are your balancing rules optimized for real usage patterns?

  • Can you absorb a 2x or 5x traffic burst?

5. Refactor Like Your Uptime Depends on It (Because It Does)

Old code slows you down. Refactoring isn’t just about readability, it’s about getting rid of code rot. Tech debt accumulates fast. And that legacy logic you’ve been ignoring? It’s dragging your latency down.

Key areas to target:

  • Nested loops

  • Repeated API calls

  • Inefficient state management

Small changes = big impact when they happen in high-traffic flows.

6. Use Caching & Indexing Like a Pro

Don’t ask your app to do the same work twice. Caching stores the results of expensive operations. Indexing makes data easier to find. Together, they slash latency.

What to cache:

  • Authentication tokens

  • Product or content metadata

  • Frequently accessed query results

What to index:

  • High-traffic tables

  • Foreign keys

  • Time-based queries

If it takes more than 200ms, ask: “Could we cache this?”

7. Test Like It’s Already in Production

Real traffic doesn’t care about your staging environment. Before going live, simulate a heavy load, stress the system, and watch it sweat. That’s where the weak points show up, not in unit tests.

Tools like Apache JMeter, Locust, and LoadRunner let you simulate realistic spikes and long-running sessions.

Bonus tip: Try to integrate performance tests into your CI/CD so nothing ships without proving it can scale.

8. Optimize Both Frontend and Backend

Users don’t care where the slowdown is; they just feel it. Fast load times start with the frontend:

  • Minify CSS and JS

  • Use lazy loading

  • Push assets via CDN

But don’t forget the backend:

  • Async operations

  • Batched requests

  • Microservices where it makes sense

With Sedai, you don’t have to. It optimizes both your frontend and backend performance automatically, keeping everything running smoothly in real-time.

9. Automate It. Then Improve It. Forever.

Manual tuning is dead. Performance optimization isn’t a one-time thing. It has to be baked into your DevOps pipeline and continuously improved.

Here’s how to embed it into your DevOps lifecycle:

DevOps Lifecycle Optimization
DevOps Lifecycle Stage Key Factors Optimization Focus
Planning & Requirements Efficient Code, Resource Management Define coding standards, optimize algorithms, and plan CPU/memory allocation for anticipated workloads.
Development (Create) Code Refactoring, Database Optimization Refactor code to eliminate inefficiencies; implement database indexing, query optimization, and caching.
Testing & Pre-Production Load Testing, Monitoring & Profiling, Caching & Indexing Simulate traffic using load testing tools, monitor performance with profiling tools, and test caching/indexing.
Release & Deployment CI/CD Pipelines, Auto-scaling Automate performance tests within CI/CD pipelines; use AI-driven auto-scaling for optimal resource allocation.
Production (Monitor) Frontend Optimization, Backend Optimization, Load Distribution Monitor and optimize frontend (e.g., lazy loading, CDN) and backend (e.g., async ops, database queries).
Post-Production (Continuous Improvement) Automation, Auto-scaling Continuously monitor performance, use AI for anomaly detection and dynamic scaling to maintain efficiency.

The table organizes and maps the key factors to specific DevOps lifecycle stages, offering a clear roadmap for integrating performance optimization practices throughout the development and operational phases of software. 

Up next: Let’s talk about common metrics to measure and positively drive your software performance for modern DevOps and SRE teams.

Common Metrics to Measure Your Software Performance
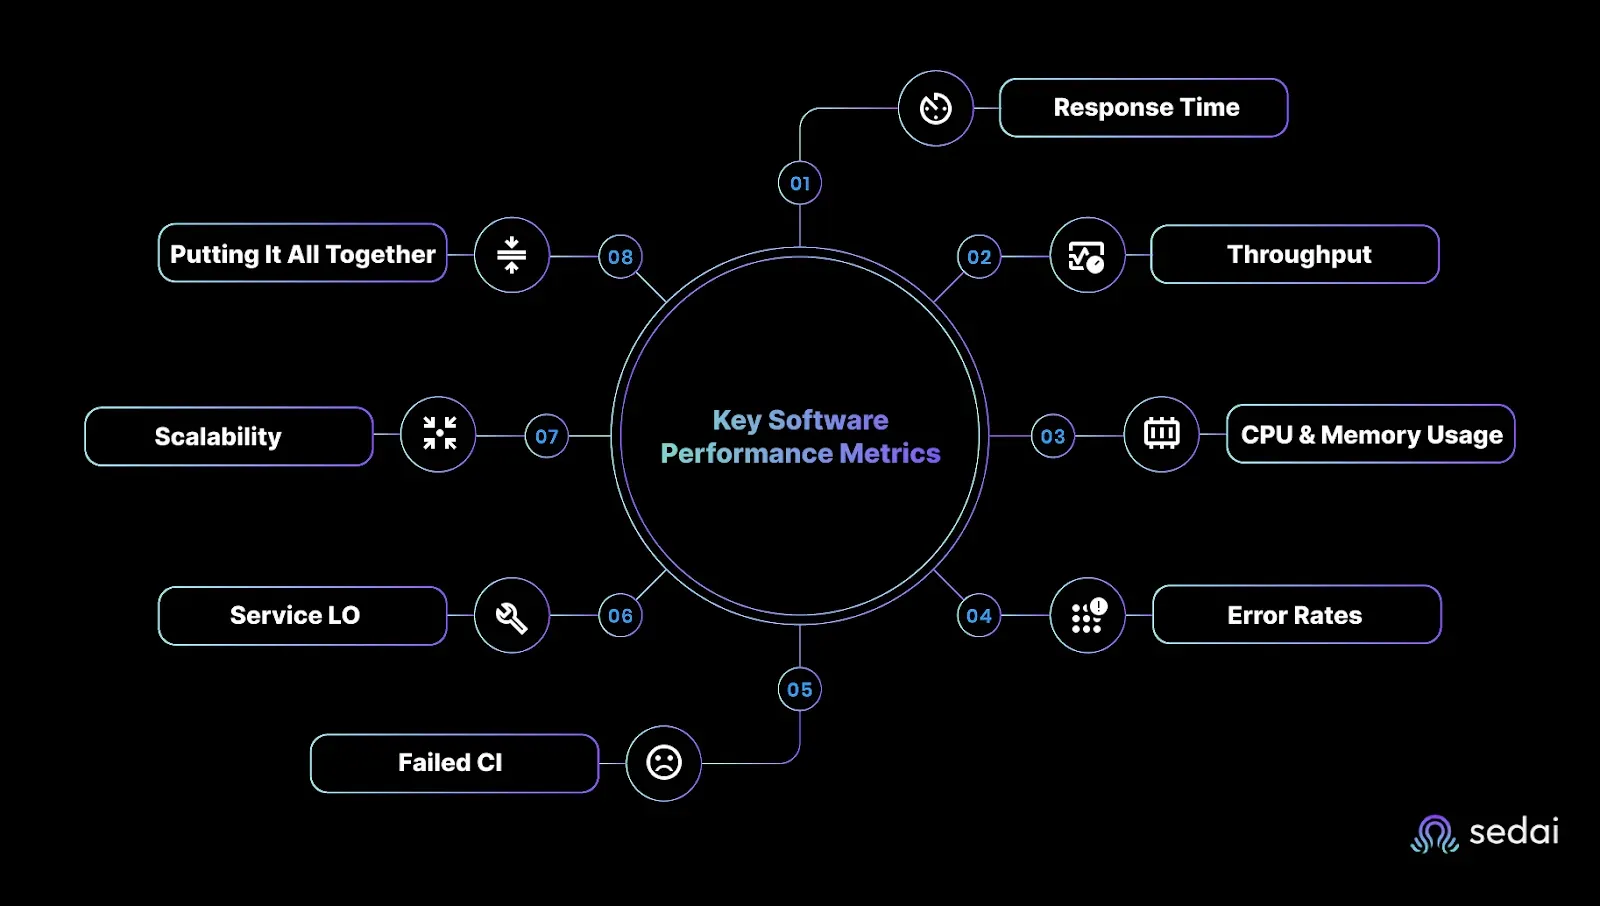
In reality, most of the time, you’re not tracking metrics for the sake of dashboards. You're doing it because performance issues are painful. They frustrate your team, impact users, and eat into your cloud budget faster than you can say "autoscaling." 

If you're a CTO pushing for speed at scale, an SRE defending your SLOs, or a DevOps engineer trying to keep production steady, you need to know exactly what to measure and why it matters.

Here are the metrics that give you the clearest signal on software performance, and how to use them to drive actual outcomes.

1. Response Time: The Frontline of User Experience

This one’s non-negotiable. Response time tells you how fast your app reacts to a user action. Anything over 200ms? That’s already pushing it. Slower response = user frustration = churn.

If you care about conversion, engagement, or just keeping your systems snappy under load, track this religiously, especially during the Verify stage of the DevOps loop.

2. Throughput: Can Your App Handle the Pressure?

Throughput measures how many requests your app can process per second or minute. You want high throughput without sacrificing latency. If response time is the speedometer, throughput is your engine capacity.

Evaluate this during the Configure stage to make sure your infrastructure can keep up when demand surges.

3. CPU & Memory Usage: The Hidden Bottlenecks

If you’re not watching CPU and memory usage, you’re guessing. High resource usage often signals inefficient code, poor architectural choices, or services crying out for optimization.

Use this data across the lifecycle, especially in the Monitor stage, to stay ahead of scaling issues and avoid unnecessary cost spikes.

4. Error Rates: What’s Breaking and Why It Matters

Errors erode trust. Failed transactions, 5xxs, unhandled exceptions, they’re all signs something's off. Track them in the Verify stage to catch issues before they impact users. And if your error rate’s spiking, don’t wait. Investigate fast and fix faster.

5. Failed Customer Interactions (FCIs): The Stuff Your Users Never Forget

This is where user intent meets system failure. FCIs are when your app technically works, but the user still can’t complete their task. Broken flows, dead buttons, confusing UX, they all count.

Analyze these in the Monitor stage to identify friction and fix it before your NPS tanks.

6. Service Level Objectives (SLOs): Your North Star for Performance

SLOs define what “good enough” looks like. They turn performance goals into measurable targets and keep your team aligned on what really matters. Set them early in the Plan stage and monitor consistently to see whether you’re meeting expectations or missing the mark.

7. Scalability: Can You Grow Without Breaking Things?

If your app can’t scale, it’ll fail, especially when user traffic spikes. Scalability is the ability to grow without degrading performance. Design for this upfront in the Design stage to avoid costly rearchitecture later.

8. Putting It All Together: Metrics in the DevOps Loop

These metrics aren’t just numbers; they fuel every stage of your DevOps cycle:

  • Plan: Define SLOs that align with business goals.

  • Design: Build for scalability from the start.

  • Configure: Ensure throughput can support a projected load.

  • Verify: Validate performance via response time and error rates.

  • Monitor: Track FCIs, CPU/memory usage, and catch issues in real time.

Want to fix performance issues, not just measure them? In the next section, learn how to spot and eliminate performance bottlenecks before your users feel the pain.

Spot Performance Problems Before They Hit Your Users
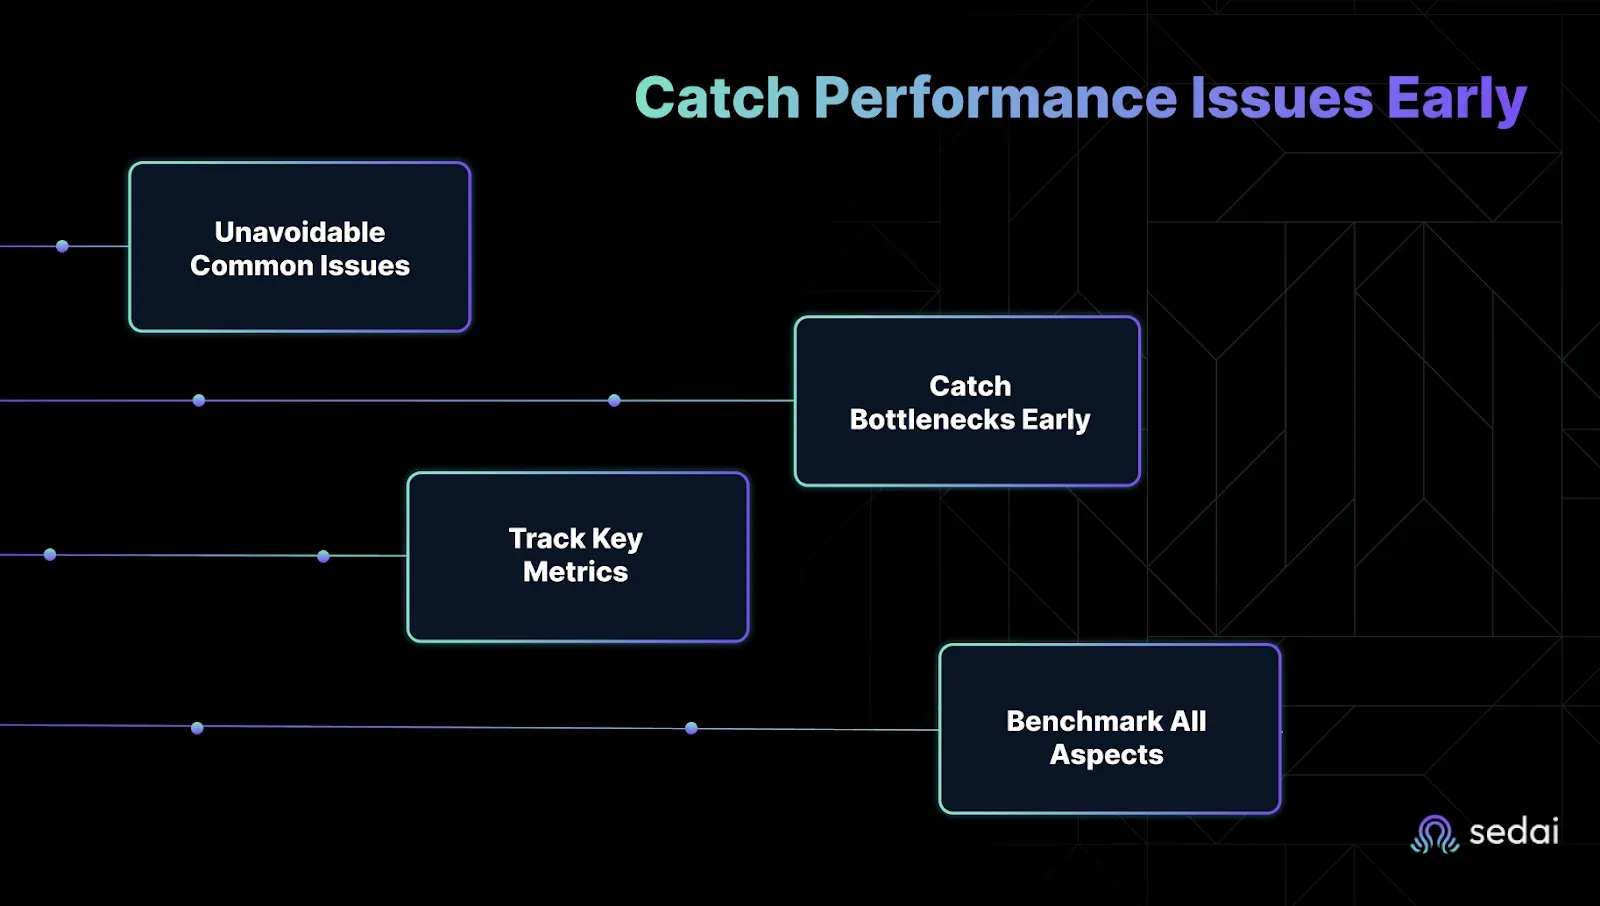
If you're chasing uptime, performance, and cost efficiency simultaneously, bottlenecks are your biggest threat.

They sneak in silently, clogging up systems, slowing down user experiences, and burning through resources. When they go unnoticed, you are left in production while explaining to leadership why things are lagging again.

The good news is that you can catch most performance issues long before they explode. You just need the right tactics built into every phase of your DevSecOps pipeline, from development to production.

Let’s break it down.

1. The Usual Suspects: Common Issues You Can’t Ignore

Technical roadblocks show up in two places: on the client side and the server side. Knowing where to look saves hours of guessing and failed fixes.

1. Client-Side (Browser + Frontend)

These issues kill UX and eat up engineering cycles fast. Here’s how to stay ahead:

  • Use AI-Powered Coding Assistants Early
    Tools like GitHub Copilot and Amazon CodeWhisperer don’t just write faster code; they write smarter code. They catch inefficient logic, suggest performance-friendly functions, and reduce frontend lag before it ever hits QA.

  • Run SAST/DAST/IAST from the Start
    Static and dynamic testing tools (like SonarQube or Veracode) help you flag clunky rendering logic, slow-loading assets, and performance-impacting vulnerabilities right in your pipeline.

2. Server-Side (Backend + Database)

When queries crawl or connections hang, everything else slows down. Don’t let backend bottlenecks catch you off guard:

  • Real-Time Logging + Monitoring
    Tools like New Relic or Dynatrace make it easy to track query latency, response times, and resource saturation. Alerts = faster fixes.

  • Vulnerability Scanning with a Performance Lens
    Snyk and similar tools go beyond basic security. They help you spot performance-degrading code patterns tied to insecure dependencies or outdated libraries, common culprits in data layer drag.

Next: Now that you know what to look for, here’s how to catch it earlier in the pipeline.

2. Catch Bottlenecks in Dev/Test Before They Hit Production

If you're still waiting until staging or prod to diagnose performance issues, you’re already too late. The smart fixes start in the development and testing stages.

1. Simulate Chaos by trying new solutions:

  • Run Chaos Engineering Experiments
    Tools like Chaos Monkey simulate infrastructure failures and stress points. They expose real-world weaknesses that normal testing misses.

  • Input Fuzzing for Edge Case Resilience
    Fuzzing tools like Atheris inject random or malformed inputs to test how your app handles the unexpected, before your users do.

2. Bake Diagnostics into the Pipeline

  • Integrate SAST Tools Early
    Use Fortify, Checkmarx, or CodeQL in your CI/CD workflows to catch inefficient logic, nested loops, and insecure code paths that lead to runtime slowdowns.

  • Only Ship Signed Code
    Enforcing software signing stops unauthorized, potentially unstable code from reaching your environment. If it’s not verified, it doesn’t go live.

Coming up: Let’s talk about what changes when your code actually hits production.

3. Track the Right Metrics to Stay Ahead

Performance metrics aren’t just numbers, they are warning signs. If you’re not tracking these, you’re guessing.

  • Time-to-First-Byte (TTFB)
    If this climbs, it usually means your backend’s lagging. Fix it before it tanks your UX.

  • Page/Application Load Time
    How long until your frontend is ready to use? This affects bounce rates and support tickets.

  • Throughput
    How many requests per second can your system handle? If this drops, you're either scaling wrong or overloaded.

Sedai also keeps an eye on these metrics for you, using AI to automatically adjust resources when something’s off. It doesn’t stop at the basics. Sedai digs into storage latency, usage patterns, and cost anomalies, then quietly rebalances workloads or shifts storage tiers when thresholds are crossed.

4. Benchmark Everything: Security, Performance, and Every Release

Every release should make your system faster and more secure. Benchmarking is how you prove that.

  • Use Monitoring + Analytics to Benchmark Performance
    Run regular tests with tools like New Relic or SeaLights. Compare each release against the last, and against industry baselines.

  • Don’t Ignore Security Metrics
    Vulnerability counts, patch velocity, and response time all impact your performance. Don’t let “secure” become “slow.”

Now that you’ve mastered diagnostics and benchmarks, let’s discuss automation and how Sedai helps you move from fixing bottlenecks to preventing them.

How Sedai Owns Cloud Performance Optimization, So You Don’t Have To

Sedai’s AI doesn’t just monitor your cloud, it acts. It continuously fine-tunes resources to keep performance sharp and costs low, all without you lifting a finger.

AI-Driven Autonomous Cloud Management Without Manual Overhead

Most performance tuning is still reactive. Sedai flips the script. Its autonomous system continuously monitors, analyzes, and optimizes your application in production, 24/7, with zero human intervention.

  • Real-time optimization: Sedai constantly analyzes app behavior and auto-tunes resources on the fly.

  • Smarter scaling: It predicts future workloads to scale just-in-time, not just based on CPU spikes.

  • Customer win: Canopy used Sedai to slash cloud management costs while improving app efficiency through automation.

Bottom line: Sedai takes the guesswork and grunt work out of cloud performance management. Learn more about autonomous cloud management.

Continuous Performance Optimization That Responds to Real Workloads

You already know pre-prod testing isn’t enough. Real users behave differently in the wild. Sedai closes that gap by shifting some performance optimization to runtime, where it really counts.

  • Always-on tuning: Sedai adjusts your cloud resources based on real traffic patterns, not just simulated tests.

  • Latency SLO protection: It dynamically tunes your stack to hit your latency goals without over-provisioning.

  • Cost impact: You’ll stay performant as workloads shift, while keeping cloud costs in check.

The takeaway: Sedai doesn’t just spot problems, it fixes them automatically. Read about Sedai’s finops optimization capabilities.

Release Intelligence That Catches Performance Regressions Instantly

Every new release carries risk. That shouldn’t mean rolling the dice with performance. Sedai’s Release Intelligence watches every deploy like a hawk and takes action when things go sideways.

  • Continuous scoring: Each new release is automatically measured against the previous one.

  • Early warnings: If latency spikes or throughput drops, your team gets an instant heads-up.

  • No drama: Stay ahead of performance regressions before they hit your users or your error budget.

Pro tip: Sedai turns your releases into data-driven, low-risk events. Transition to Smart SLO Management below.

Case Study: How Sedai’s Proactive Monitoring Improved Performance for KnowBe4

KnowBe4 needed to reduce the overhead of cloud management and meet strict performance targets on Amazon ECS. They turned to Sedai and got exactly that, without adding headcount or complexity.

  • Performance gains: Sedai tuned infrastructure continuously, reducing latency and improving availability.

  • Cost reduction: Cloud spend dropped as Sedai eliminated waste and optimized resource allocation.

  • Operational efficiency: KnowBe4 scaled rapidly without sacrificing reliability or overworking the team.

Recognition: Sedai was also named in Gartner’s first-ever Platform Engineering Hype Cycle, solidifying its place as a leader in autonomous cloud optimization.

If you want to scale like KnowBe4, Sedai is your partner.

Conclusion

You didn’t sign up to play cloud cost whack-a-mole or chase performance issues after users feel the lag. You want systems that run fast, scale smart, and stay within budget without burning out your team.

That’s where performance optimization becomes your power play. Tuning software early and continuously helps avoid latency spikes, surprise bills, and downtime dramas. But doing this manually at scale is an extra task you don’t have time for.

Sedai changes the game with AI-driven performance tuning. It analyzes real-time app behavior, manages SLOs, rightsizes infrastructure, and automatically slashes costs. There are no manual configs, just software that gets smarter as it runs.

Join hands with Sedai and discover how effortless it can be to achieve continuous software performance optimization. 

FAQ

1. Why is performance optimization critical for cloud-native apps in 2025?

With distributed architectures (microservices, serverless) and rising user expectations, even minor latency or inefficiencies impact scalability, costs, and customer experience.

2. How does AI/ML automate performance tuning?

AI analyzes metrics (CPU, memory, latency) in real time to auto-scale resources, optimize queries, and predict bottlenecks, reducing manual toil.

3. What are the biggest performance killers in cloud-native apps?

Common issues include:

  • Poorly optimized database queries
  • Inefficient container orchestration
  • Network latency in multi-cloud setups
  • Over-provisioned/underutilized resources

4. Can serverless functions hurt performance?

Yes, cold starts, improper memory allocation, and poorly designed triggers can degrade response times. Tools like Sedai help auto-tune configurations.

5. How do you balance cost vs. performance in the cloud?

Use:

  • Spot/preemptible instances for non-critical workloads
  • AI-driven autoscaling (e.g., Kubernetes VPA/HPA)
  • FinOps practices to track waste

Was this content helpful?

Thank you for submitting your feedback.
Oops! Something went wrong while submitting the form.

Related Posts

CONTENTS

Software Performance Optimization: The Expert Guide for 2025

Published on
Last updated on

June 17, 2025

Max 3 min
Software Performance Optimization: The Expert Guide for 2025

We don’t need to convince you that it’s helpful to optimize your software’s performance. The result is lower costs, less latency, and probably a pat on the back from your boss.

But you’re busy. And chances are, you’ve got a lot of applications you’re responsible for. That’s why we created this expert guide to quickly make sure your software runs well, along with recommendations for how to reach the next level of optimization, using AI.

Impact on User Experience

When your app slows down, users bounce. You already know performance isn't just a tech issue; it's a business risk. But, there is a slight change since not all workloads are same. Real-time transactions, batch jobs, and API calls each have a different performance threshold. What works for one may not work for another.

Performance That Hits the Bottom Line

Amazon famously discovered that a 100ms delay in page load times caused a 1% drop in revenue. That’s not a rounding error; it’s millions of dollars. And it’s proof that latency is expensive.

If you’re running e-commerce or customer-facing apps, you’ve felt this. Slow pages mean lost carts. Hesitations mean lower conversions. The customer doesn’t wait; they just leave.

Here’s what that means for you:

  • Latency must be a monitored and enforced SLO.

  • Performance tuning can’t be static,  it has to adjust to usage patterns.

  • Every millisecond matters when dollars are on the line.

Amazon’s example isn’t extreme. It’s the new normal. Even when you're scaling up for a flash sale or throttling background processes to save cost, performance has to align with real-time demand.

The New Pressure from AI Apps

AI has raised the bar. Today’s users expect instant answers from LLMs, not spinning loaders. If your system can't keep up, they won't stick around.

Here’s what you’re up against:

  • LLM-powered features that require sub-second response times

  • Spiky, unpredictable workloads that make traditional tuning irrelevant

  • Complex user journeys that combine search, prediction, and real-time personalization

Performance now has to be smart, not just fast. That’s where AI-driven optimization tools come in. They don’t just flag slow endpoints; they predict and prevent them. Think real-time monitoring that doesn’t just observe but acts.

You can use AI to:

  • Automatically detect and fix bottlenecks before they affect users

  • Prioritize performance tuning based on real-world usage patterns

  • Maintain SLOs without over-provisioning or blowing your budget

Sedai takes it a step further. It’s the world’s first self-driving cloud, continuously adjusting and optimizing your resources in real-time. No more waiting for slow endpoints to catch up, Sedai acts before the problem even hits.

Bottom line: if you're not proactively tuning for both performance and cost, you're already falling behind.

Next: Let’s examine how autonomous systems are changing the game for performance optimization across the DevOps lifecycle and why manual tuning is no longer enough.

What Really Drives Software Performance And How to Own It

Performance isn't just about speed; it's about stability under pressure. It’s about keeping your latency SLOs green, your cloud bill under control, and your team out of excess workload mode.

Yet performance bottlenecks continue to appear in the same painful places through bloated code, inefficient database queries, and surprise traffic spikes your infrastructure wasn’t ready for.

Let’s break down the real drivers of performance and where you can take action before your next incident.

1. Write Smarter, Cleaner Code

The cleaner and more efficient your code is, the faster your app runs. Sounds obvious, but teams still underestimate how much latency comes from things like:

  • Poor algorithm selection

  • Redundant logic

  • Unoptimized loops

  • Complex call stacks

If you’re chasing tight latency SLOs, every millisecond matters. Focus on simplicity and speed, not cleverness.

Next step: Start using profiling tools to spot the slowest lines of your code. Don't guess, measure.

2. Master Your Resource Management

Overprovisioning is expensive. Underprovisioning is a support ticket waiting to happen. CPU, memory, and network throughput need to be tuned in real time. You can’t afford static configs in a dynamic system.

Tools like AWS Auto Scaling or Kubernetes HPA let you adjust based on live metrics, not gut feeling.

Performance tip: Set up dynamic thresholds for scaling, and use AI/ML to fine-tune based on real usage patterns. That’s where autonomous optimization shines.

3. Fix Your Database 

A slow query will kill your performance faster than a failing pod. The database is often the silent killer. If you're seeing latency spikes, check for:

  • Missing indexes

  • Expensive joins

  • Poorly cached queries

Quick wins:

  • Use Redis or Memcached for hot data

  • Run query analysis on your top 10 endpoints

  • Add indexing to high-read columns

Your app is only as fast as your worst query.

4. Balance the Load Before It Breaks You

No single server should carry the whole weight. Load balancers (like NGINX, HAProxy, or AWS ELB) spread traffic so there isn’t a single point of failure or meltdown.

Smart load distribution avoids throttling and gives you headroom when traffic surges.

What to check:

  • Are your balancing rules optimized for real usage patterns?

  • Can you absorb a 2x or 5x traffic burst?

5. Refactor Like Your Uptime Depends on It (Because It Does)

Old code slows you down. Refactoring isn’t just about readability, it’s about getting rid of code rot. Tech debt accumulates fast. And that legacy logic you’ve been ignoring? It’s dragging your latency down.

Key areas to target:

  • Nested loops

  • Repeated API calls

  • Inefficient state management

Small changes = big impact when they happen in high-traffic flows.

6. Use Caching & Indexing Like a Pro

Don’t ask your app to do the same work twice. Caching stores the results of expensive operations. Indexing makes data easier to find. Together, they slash latency.

What to cache:

  • Authentication tokens

  • Product or content metadata

  • Frequently accessed query results

What to index:

  • High-traffic tables

  • Foreign keys

  • Time-based queries

If it takes more than 200ms, ask: “Could we cache this?”

7. Test Like It’s Already in Production

Real traffic doesn’t care about your staging environment. Before going live, simulate a heavy load, stress the system, and watch it sweat. That’s where the weak points show up, not in unit tests.

Tools like Apache JMeter, Locust, and LoadRunner let you simulate realistic spikes and long-running sessions.

Bonus tip: Try to integrate performance tests into your CI/CD so nothing ships without proving it can scale.

8. Optimize Both Frontend and Backend

Users don’t care where the slowdown is; they just feel it. Fast load times start with the frontend:

  • Minify CSS and JS

  • Use lazy loading

  • Push assets via CDN

But don’t forget the backend:

  • Async operations

  • Batched requests

  • Microservices where it makes sense

With Sedai, you don’t have to. It optimizes both your frontend and backend performance automatically, keeping everything running smoothly in real-time.

9. Automate It. Then Improve It. Forever.

Manual tuning is dead. Performance optimization isn’t a one-time thing. It has to be baked into your DevOps pipeline and continuously improved.

Here’s how to embed it into your DevOps lifecycle:

DevOps Lifecycle Optimization
DevOps Lifecycle Stage Key Factors Optimization Focus
Planning & Requirements Efficient Code, Resource Management Define coding standards, optimize algorithms, and plan CPU/memory allocation for anticipated workloads.
Development (Create) Code Refactoring, Database Optimization Refactor code to eliminate inefficiencies; implement database indexing, query optimization, and caching.
Testing & Pre-Production Load Testing, Monitoring & Profiling, Caching & Indexing Simulate traffic using load testing tools, monitor performance with profiling tools, and test caching/indexing.
Release & Deployment CI/CD Pipelines, Auto-scaling Automate performance tests within CI/CD pipelines; use AI-driven auto-scaling for optimal resource allocation.
Production (Monitor) Frontend Optimization, Backend Optimization, Load Distribution Monitor and optimize frontend (e.g., lazy loading, CDN) and backend (e.g., async ops, database queries).
Post-Production (Continuous Improvement) Automation, Auto-scaling Continuously monitor performance, use AI for anomaly detection and dynamic scaling to maintain efficiency.

The table organizes and maps the key factors to specific DevOps lifecycle stages, offering a clear roadmap for integrating performance optimization practices throughout the development and operational phases of software. 

Up next: Let’s talk about common metrics to measure and positively drive your software performance for modern DevOps and SRE teams.

Common Metrics to Measure Your Software Performance

In reality, most of the time, you’re not tracking metrics for the sake of dashboards. You're doing it because performance issues are painful. They frustrate your team, impact users, and eat into your cloud budget faster than you can say "autoscaling." 

If you're a CTO pushing for speed at scale, an SRE defending your SLOs, or a DevOps engineer trying to keep production steady, you need to know exactly what to measure and why it matters.

Here are the metrics that give you the clearest signal on software performance, and how to use them to drive actual outcomes.

1. Response Time: The Frontline of User Experience

This one’s non-negotiable. Response time tells you how fast your app reacts to a user action. Anything over 200ms? That’s already pushing it. Slower response = user frustration = churn.

If you care about conversion, engagement, or just keeping your systems snappy under load, track this religiously, especially during the Verify stage of the DevOps loop.

2. Throughput: Can Your App Handle the Pressure?

Throughput measures how many requests your app can process per second or minute. You want high throughput without sacrificing latency. If response time is the speedometer, throughput is your engine capacity.

Evaluate this during the Configure stage to make sure your infrastructure can keep up when demand surges.

3. CPU & Memory Usage: The Hidden Bottlenecks

If you’re not watching CPU and memory usage, you’re guessing. High resource usage often signals inefficient code, poor architectural choices, or services crying out for optimization.

Use this data across the lifecycle, especially in the Monitor stage, to stay ahead of scaling issues and avoid unnecessary cost spikes.

4. Error Rates: What’s Breaking and Why It Matters

Errors erode trust. Failed transactions, 5xxs, unhandled exceptions, they’re all signs something's off. Track them in the Verify stage to catch issues before they impact users. And if your error rate’s spiking, don’t wait. Investigate fast and fix faster.

5. Failed Customer Interactions (FCIs): The Stuff Your Users Never Forget

This is where user intent meets system failure. FCIs are when your app technically works, but the user still can’t complete their task. Broken flows, dead buttons, confusing UX, they all count.

Analyze these in the Monitor stage to identify friction and fix it before your NPS tanks.

6. Service Level Objectives (SLOs): Your North Star for Performance

SLOs define what “good enough” looks like. They turn performance goals into measurable targets and keep your team aligned on what really matters. Set them early in the Plan stage and monitor consistently to see whether you’re meeting expectations or missing the mark.

7. Scalability: Can You Grow Without Breaking Things?

If your app can’t scale, it’ll fail, especially when user traffic spikes. Scalability is the ability to grow without degrading performance. Design for this upfront in the Design stage to avoid costly rearchitecture later.

8. Putting It All Together: Metrics in the DevOps Loop

These metrics aren’t just numbers; they fuel every stage of your DevOps cycle:

  • Plan: Define SLOs that align with business goals.

  • Design: Build for scalability from the start.

  • Configure: Ensure throughput can support a projected load.

  • Verify: Validate performance via response time and error rates.

  • Monitor: Track FCIs, CPU/memory usage, and catch issues in real time.

Want to fix performance issues, not just measure them? In the next section, learn how to spot and eliminate performance bottlenecks before your users feel the pain.

Spot Performance Problems Before They Hit Your Users

If you're chasing uptime, performance, and cost efficiency simultaneously, bottlenecks are your biggest threat.

They sneak in silently, clogging up systems, slowing down user experiences, and burning through resources. When they go unnoticed, you are left in production while explaining to leadership why things are lagging again.

The good news is that you can catch most performance issues long before they explode. You just need the right tactics built into every phase of your DevSecOps pipeline, from development to production.

Let’s break it down.

1. The Usual Suspects: Common Issues You Can’t Ignore

Technical roadblocks show up in two places: on the client side and the server side. Knowing where to look saves hours of guessing and failed fixes.

1. Client-Side (Browser + Frontend)

These issues kill UX and eat up engineering cycles fast. Here’s how to stay ahead:

  • Use AI-Powered Coding Assistants Early
    Tools like GitHub Copilot and Amazon CodeWhisperer don’t just write faster code; they write smarter code. They catch inefficient logic, suggest performance-friendly functions, and reduce frontend lag before it ever hits QA.

  • Run SAST/DAST/IAST from the Start
    Static and dynamic testing tools (like SonarQube or Veracode) help you flag clunky rendering logic, slow-loading assets, and performance-impacting vulnerabilities right in your pipeline.

2. Server-Side (Backend + Database)

When queries crawl or connections hang, everything else slows down. Don’t let backend bottlenecks catch you off guard:

  • Real-Time Logging + Monitoring
    Tools like New Relic or Dynatrace make it easy to track query latency, response times, and resource saturation. Alerts = faster fixes.

  • Vulnerability Scanning with a Performance Lens
    Snyk and similar tools go beyond basic security. They help you spot performance-degrading code patterns tied to insecure dependencies or outdated libraries, common culprits in data layer drag.

Next: Now that you know what to look for, here’s how to catch it earlier in the pipeline.

2. Catch Bottlenecks in Dev/Test Before They Hit Production

If you're still waiting until staging or prod to diagnose performance issues, you’re already too late. The smart fixes start in the development and testing stages.

1. Simulate Chaos by trying new solutions:

  • Run Chaos Engineering Experiments
    Tools like Chaos Monkey simulate infrastructure failures and stress points. They expose real-world weaknesses that normal testing misses.

  • Input Fuzzing for Edge Case Resilience
    Fuzzing tools like Atheris inject random or malformed inputs to test how your app handles the unexpected, before your users do.

2. Bake Diagnostics into the Pipeline

  • Integrate SAST Tools Early
    Use Fortify, Checkmarx, or CodeQL in your CI/CD workflows to catch inefficient logic, nested loops, and insecure code paths that lead to runtime slowdowns.

  • Only Ship Signed Code
    Enforcing software signing stops unauthorized, potentially unstable code from reaching your environment. If it’s not verified, it doesn’t go live.

Coming up: Let’s talk about what changes when your code actually hits production.

3. Track the Right Metrics to Stay Ahead

Performance metrics aren’t just numbers, they are warning signs. If you’re not tracking these, you’re guessing.

  • Time-to-First-Byte (TTFB)
    If this climbs, it usually means your backend’s lagging. Fix it before it tanks your UX.

  • Page/Application Load Time
    How long until your frontend is ready to use? This affects bounce rates and support tickets.

  • Throughput
    How many requests per second can your system handle? If this drops, you're either scaling wrong or overloaded.

Sedai also keeps an eye on these metrics for you, using AI to automatically adjust resources when something’s off. It doesn’t stop at the basics. Sedai digs into storage latency, usage patterns, and cost anomalies, then quietly rebalances workloads or shifts storage tiers when thresholds are crossed.

4. Benchmark Everything: Security, Performance, and Every Release

Every release should make your system faster and more secure. Benchmarking is how you prove that.

  • Use Monitoring + Analytics to Benchmark Performance
    Run regular tests with tools like New Relic or SeaLights. Compare each release against the last, and against industry baselines.

  • Don’t Ignore Security Metrics
    Vulnerability counts, patch velocity, and response time all impact your performance. Don’t let “secure” become “slow.”

Now that you’ve mastered diagnostics and benchmarks, let’s discuss automation and how Sedai helps you move from fixing bottlenecks to preventing them.

How Sedai Owns Cloud Performance Optimization, So You Don’t Have To

Sedai’s AI doesn’t just monitor your cloud, it acts. It continuously fine-tunes resources to keep performance sharp and costs low, all without you lifting a finger.

AI-Driven Autonomous Cloud Management Without Manual Overhead

Most performance tuning is still reactive. Sedai flips the script. Its autonomous system continuously monitors, analyzes, and optimizes your application in production, 24/7, with zero human intervention.

  • Real-time optimization: Sedai constantly analyzes app behavior and auto-tunes resources on the fly.

  • Smarter scaling: It predicts future workloads to scale just-in-time, not just based on CPU spikes.

  • Customer win: Canopy used Sedai to slash cloud management costs while improving app efficiency through automation.

Bottom line: Sedai takes the guesswork and grunt work out of cloud performance management. Learn more about autonomous cloud management.

Continuous Performance Optimization That Responds to Real Workloads

You already know pre-prod testing isn’t enough. Real users behave differently in the wild. Sedai closes that gap by shifting some performance optimization to runtime, where it really counts.

  • Always-on tuning: Sedai adjusts your cloud resources based on real traffic patterns, not just simulated tests.

  • Latency SLO protection: It dynamically tunes your stack to hit your latency goals without over-provisioning.

  • Cost impact: You’ll stay performant as workloads shift, while keeping cloud costs in check.

The takeaway: Sedai doesn’t just spot problems, it fixes them automatically. Read about Sedai’s finops optimization capabilities.

Release Intelligence That Catches Performance Regressions Instantly

Every new release carries risk. That shouldn’t mean rolling the dice with performance. Sedai’s Release Intelligence watches every deploy like a hawk and takes action when things go sideways.

  • Continuous scoring: Each new release is automatically measured against the previous one.

  • Early warnings: If latency spikes or throughput drops, your team gets an instant heads-up.

  • No drama: Stay ahead of performance regressions before they hit your users or your error budget.

Pro tip: Sedai turns your releases into data-driven, low-risk events. Transition to Smart SLO Management below.

Case Study: How Sedai’s Proactive Monitoring Improved Performance for KnowBe4

KnowBe4 needed to reduce the overhead of cloud management and meet strict performance targets on Amazon ECS. They turned to Sedai and got exactly that, without adding headcount or complexity.

  • Performance gains: Sedai tuned infrastructure continuously, reducing latency and improving availability.

  • Cost reduction: Cloud spend dropped as Sedai eliminated waste and optimized resource allocation.

  • Operational efficiency: KnowBe4 scaled rapidly without sacrificing reliability or overworking the team.

Recognition: Sedai was also named in Gartner’s first-ever Platform Engineering Hype Cycle, solidifying its place as a leader in autonomous cloud optimization.

If you want to scale like KnowBe4, Sedai is your partner.

Conclusion

You didn’t sign up to play cloud cost whack-a-mole or chase performance issues after users feel the lag. You want systems that run fast, scale smart, and stay within budget without burning out your team.

That’s where performance optimization becomes your power play. Tuning software early and continuously helps avoid latency spikes, surprise bills, and downtime dramas. But doing this manually at scale is an extra task you don’t have time for.

Sedai changes the game with AI-driven performance tuning. It analyzes real-time app behavior, manages SLOs, rightsizes infrastructure, and automatically slashes costs. There are no manual configs, just software that gets smarter as it runs.

Join hands with Sedai and discover how effortless it can be to achieve continuous software performance optimization. 

FAQ

1. Why is performance optimization critical for cloud-native apps in 2025?

With distributed architectures (microservices, serverless) and rising user expectations, even minor latency or inefficiencies impact scalability, costs, and customer experience.

2. How does AI/ML automate performance tuning?

AI analyzes metrics (CPU, memory, latency) in real time to auto-scale resources, optimize queries, and predict bottlenecks, reducing manual toil.

3. What are the biggest performance killers in cloud-native apps?

Common issues include:

  • Poorly optimized database queries
  • Inefficient container orchestration
  • Network latency in multi-cloud setups
  • Over-provisioned/underutilized resources

4. Can serverless functions hurt performance?

Yes, cold starts, improper memory allocation, and poorly designed triggers can degrade response times. Tools like Sedai help auto-tune configurations.

5. How do you balance cost vs. performance in the cloud?

Use:

  • Spot/preemptible instances for non-critical workloads
  • AI-driven autoscaling (e.g., Kubernetes VPA/HPA)
  • FinOps practices to track waste

Was this content helpful?

Thank you for submitting your feedback.
Oops! Something went wrong while submitting the form.