Attend a Live Product Tour to see Sedai in action.

Register now
More
Close

Autonomous Builds on Observability: Picking the right metrics

Last updated

August 9, 2024

Published
Topics
Last updated

August 9, 2024

Published

Reduce your cloud costs by 50%, safely

  • Optimize compute, storage and data

  • Choose copilot or autopilot execution

  • Continuously improve with reinforcement learning

CONTENTS

Autonomous Builds on Observability: Picking the right metrics

Note: this blog is based on a talk given by Nikhil Gopinath of Sedai and Tsahi Peleg of Palo Alto Networks at autocon/22.

Introduction

In the field of engineering, there's a widely recognized principle: "You can only manage things that you can measure." This principle highlights the importance of having measurable data to effectively monitor and manage your system. However, as with many good things, there can be too much of it. That leads us to the question: How much data is too much, and what issues can arise from an excessive abundance of metrics?

In our discussion, we will explore the potential problems associated with an overwhelming influx of data and metrics. We'll touch upon the delicate balance between gathering enough information to make informed decisions and drowning in a sea of superfluous data. Tsahi Peleg of Palo Alto Networks will then provide us with valuable insights into how Palo Alto Networks has successfully tackled this issue.

Furthermore, I'll be sharing Sedai's approach to metrics prioritization, which offers a tailored and scalable solution. I'm excited to walk you through the steps we've taken to ensure that our clients can focus on the metrics that align with their specific needs. You can watch the original video here.

What is Autonomous Cloud Management

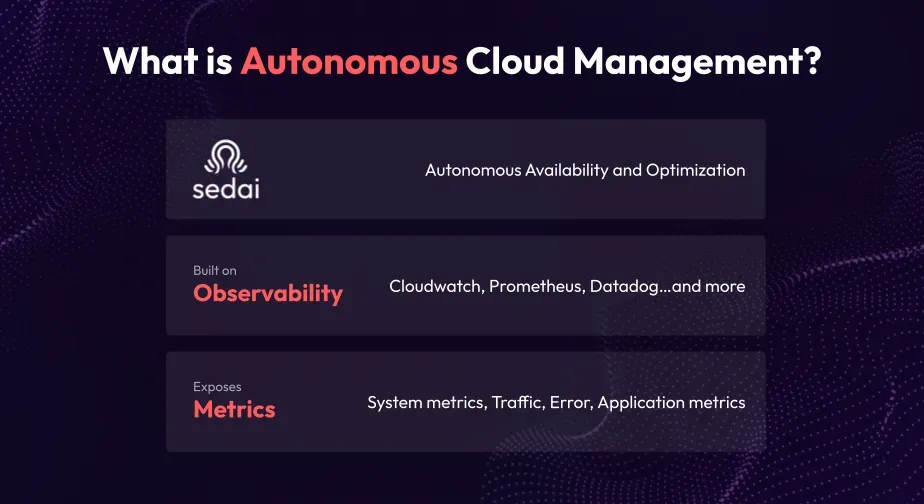
Autonomous Cloud Management, exemplified by Sedai, is a platform that autonomously oversees and optimizes your cloud infrastructure, applications, and microservices. By leveraging observability platforms like Cloudwatch, Prometheus, and Datadog, Sedai utilizes metrics, including system metrics, application metrics, topology information, and tickets, to ensure availability and optimization.
Sedai’s Architecture

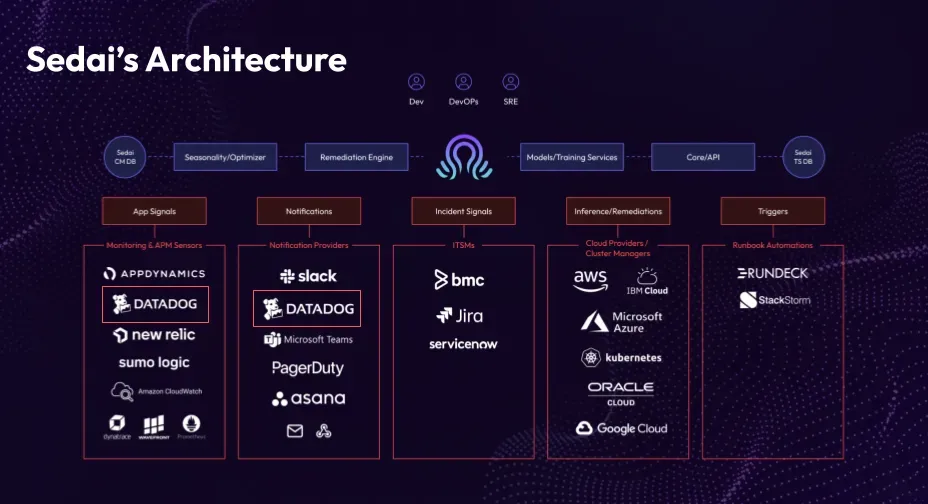
Sedai's architecture incorporates APMs, monitoring systems (e.g., Datadog, New Relic), and notification providers (e.g., Slack, PagerDuty) on the left side. It integrates with ticketing systems (e.g., BMC, Jira, ServiceNow), cloud providers, and automation systems (e.g., Stack Stone, Rundeck). This setup enables Sedai to gather detailed information, push/pull notifications, and utilize data from various sources, including cloud providers. The architecture reflects the scale and complexity of the challenges Sedai typically handles.
Part 1: Metrics Overload

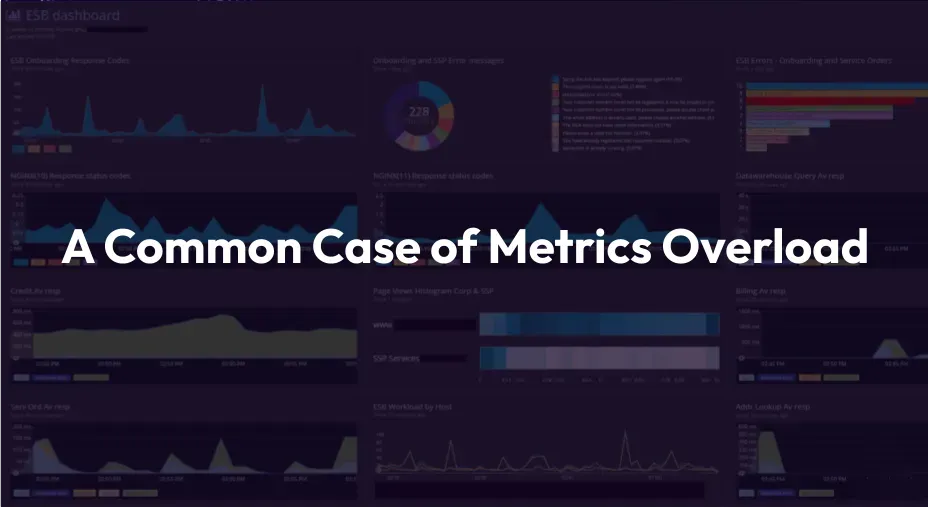
Let's talk about the problem of metrics overload, namely having too many metrics. 
There are four common causes:

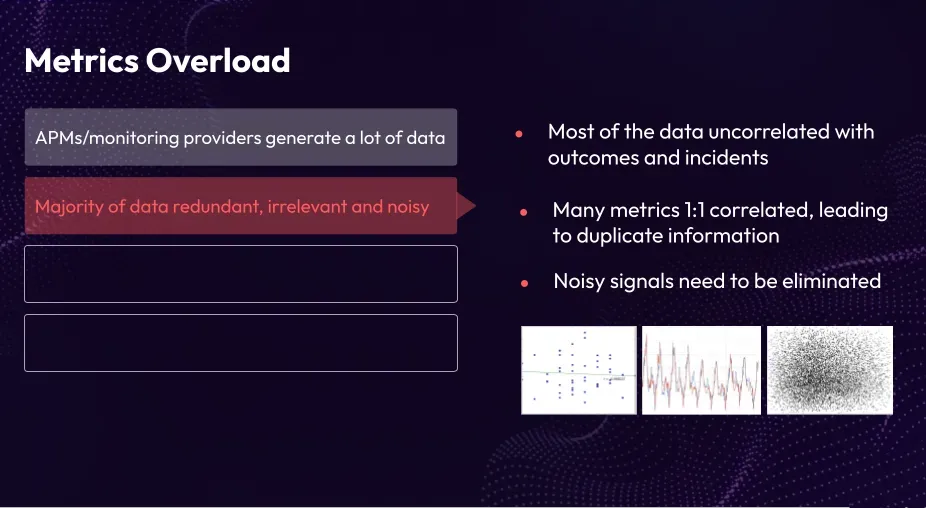
Cause 1: APMs/monitoring providers generate a lot of data

APMs and monitoring providers generate abundant data. Analyzing and utilizing this data for models, analytics, and predictions pose challenges due to the vast number of metrics involved. For instance, a single monitored application can produce over 135 metrics. When dealing with numerous serverless applications in a system, the metric count exponentially multiplies.

Cause 2: Majority of data redundant, irrelevant and noisy

The majority of data generated by APMs and monitoring providers is often redundant, irrelevant, and noisy. Much of this data lacks correlation with other metrics, making it individually useful but not necessarily relevant to specific problem identification or prevention. On the other hand, many metrics exhibit direct correlation, leading to potential redundancy and duplication of information. Additionally, signals can be noisy due to factors such as sensor tuning or inherent system noise. Consequently, some data may lack value and fail to provide predictive insights.
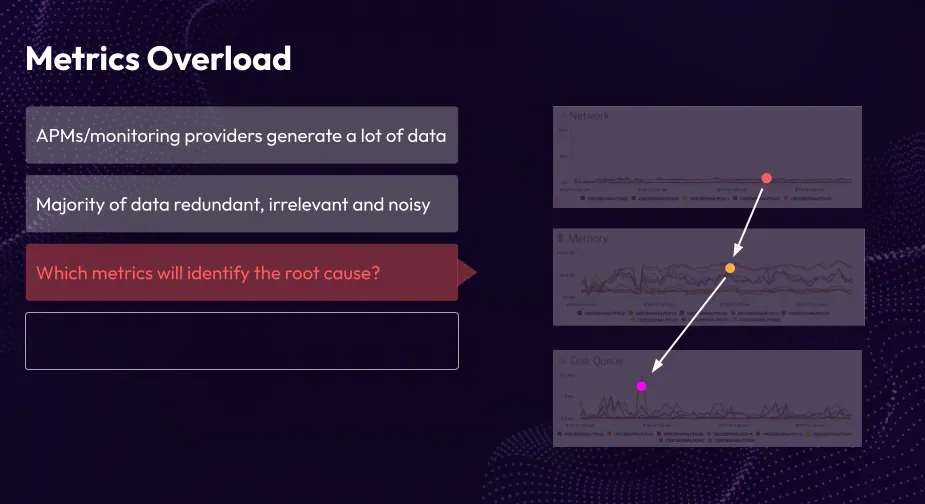
Cause 3: Not all metrics identify the root cause

As the number of metrics grows, it becomes challenging to determine the root cause of issues. Identifying the specific metric that triggered a change or caused an outage requires stepping back in time. With an increasing number of metrics, conducting root cause analysis becomes more difficult, making it harder to pinpoint the fundamental factor behind system problems or outages.
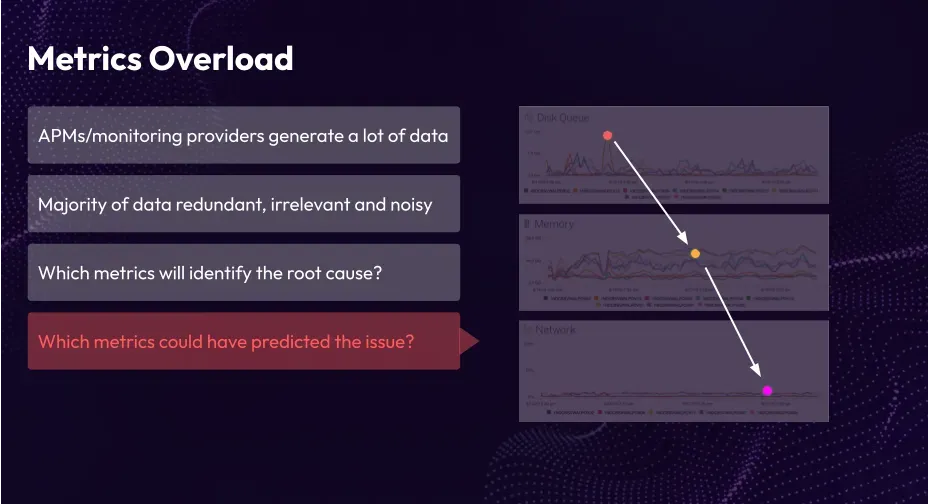
Cause 4: Not all metrics have predictive power

With a temporal perspective, determining which metrics could have predicted an issue becomes a complex task. Predicting future outcomes and understanding the downstream impacts of metrics becomes increasingly challenging as the number of metrics increases. Hence, prioritizing metrics becomes crucial in addressing the challenges associated with the volume of metrics.
Part 2: Palo AltoNetwork’s Approach to Choosing Observability Metrics

Palo Alto Networks: Overview

Palo Alto Networks is a leading global cyber security vendor specializing in various fields like network security, automation of security, operations center, cloud security, and also a security research unit. They develop every part of the security solution as a platform, hoping to be partners for managing the security challenges of different enterprises.

SASE is one of the solutions that they are providing to customers in the last few years. It's actually a revolutionary approach to be as tuned as it should be, or there is inherent noise in the system. There is data that inherently has enterprise networking. It's a new model for enterprise networking, which grew significantly in the last few years because of the increase in remote workers and also in cloud based applications.

The concept is to provide enterprise network and security as a cloud-based service. Palo Alto  Networks runs firewalls, routers, and other network/security appliances in their cloud, enabling end users to connect to their enterprise network and applications from various locations. The challenge lies in monitoring the solution's operational status and reducing excessive noise caused by an overwhelming number of emitted metrics.

Our Monitoring Challenge
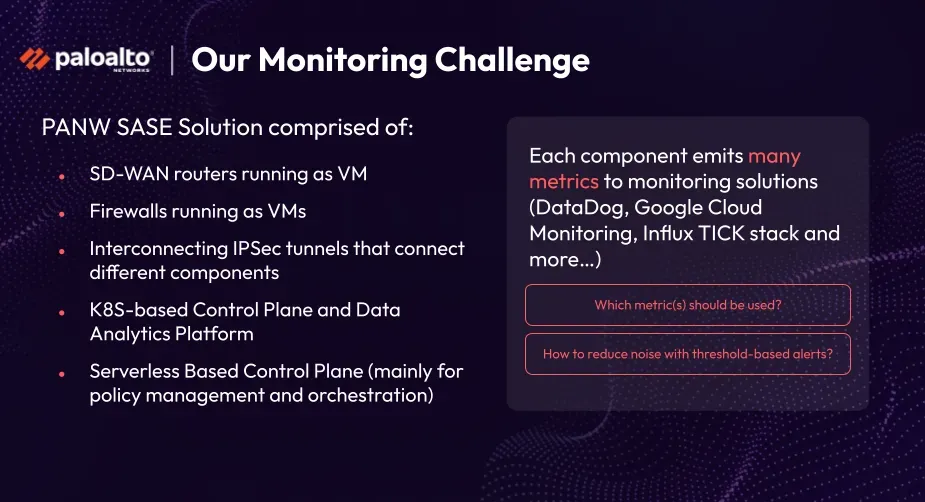
The solution comprises several components: SD-WAN routers and firewalls running as VMs in the cloud, interconnected through IPSec tunnels to form the enterprise network. A K8S-based control plane and Data Analytics Platform oversee the entire networking solution, while a serverless control plane manages policy orchestration for the firewalls and SD-WAN routers. Each component generates numerous metrics for our monitoring solutions, including DataDog, Google Cloud Monitoring, and Influx TICK stack. However, determining the relevant metrics poses a challenge. It is crucial to identify metrics that truly indicate significant issues rather than getting overwhelmed by noise. Simply monitoring all metrics and setting threshold-based alerts can lead to difficulties in pinpointing the root causes of real problems amidst the noise.
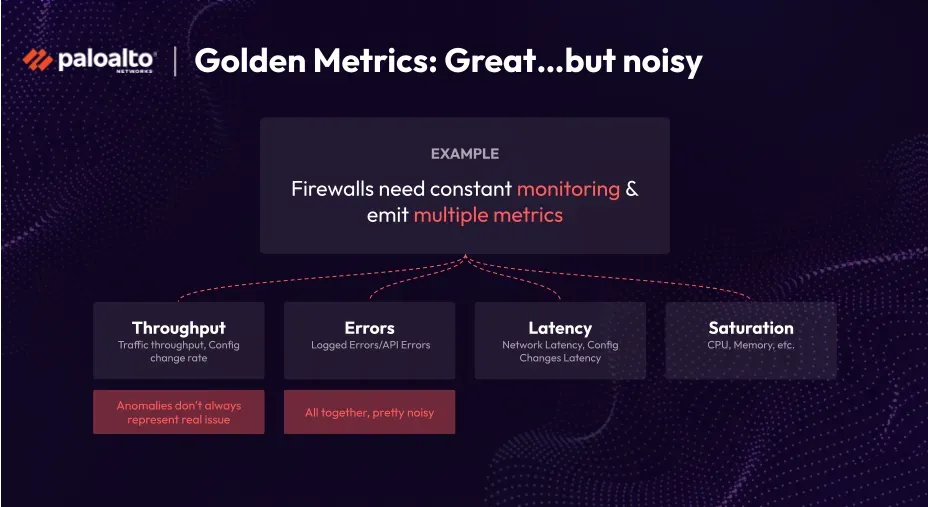
To monitor the system effectively, focus is placed on key metrics known as "golden metrics." In the case of firewalls, four categories of golden metrics are considered. These include throughput metrics, which encompass configuration changes and actual traffic throughput. Error metrics track API errors and logged errors in firewall logs. Latency metrics cover security processing, network latency, and API/config latency. Saturation metrics include CPU and memory usage. While around 100 metrics are emitted by the firewalls, setting alerts based on thresholds for all of them can lead to excessive noise.

Monitoring Approach

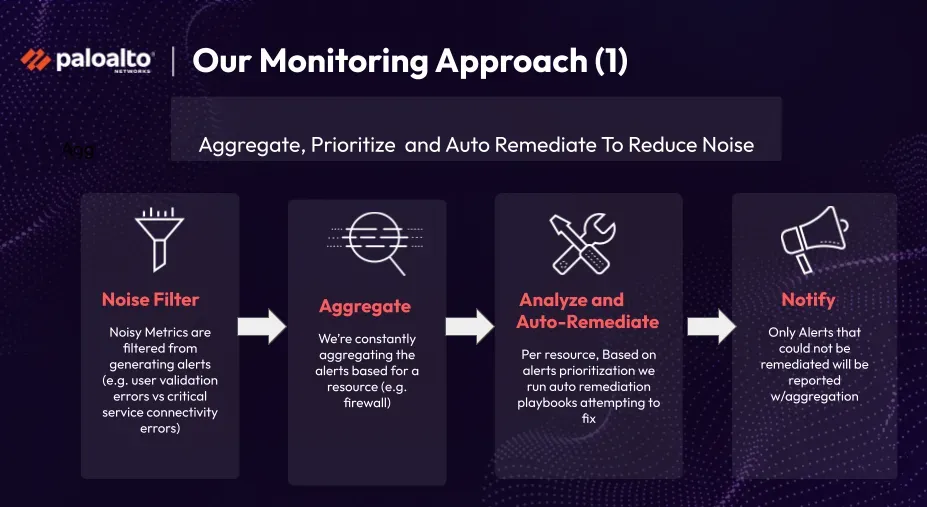
To create a monitoring solution that avoids excessive noise, several steps were implemented. Initially, all metrics were collected and made accessible through platforms like Google Data Studio or Grafana. Noise was filtered out by excluding errors that didn't indicate real issues, such as user validation errors. Critical service connectivity errors were prioritized for generating alerts. Alerts were then aggregated per resource, such as firewalls, and prioritized based on severity. Auto-remediation was attempted for certain issues, such as resetting caches or configurations and restarting services. Only alerts that couldn't be remediated were escalated to the SRE team. By following these steps of aggregation, analysis, and auto-remediation, noise was effectively reduced for the SRE team.
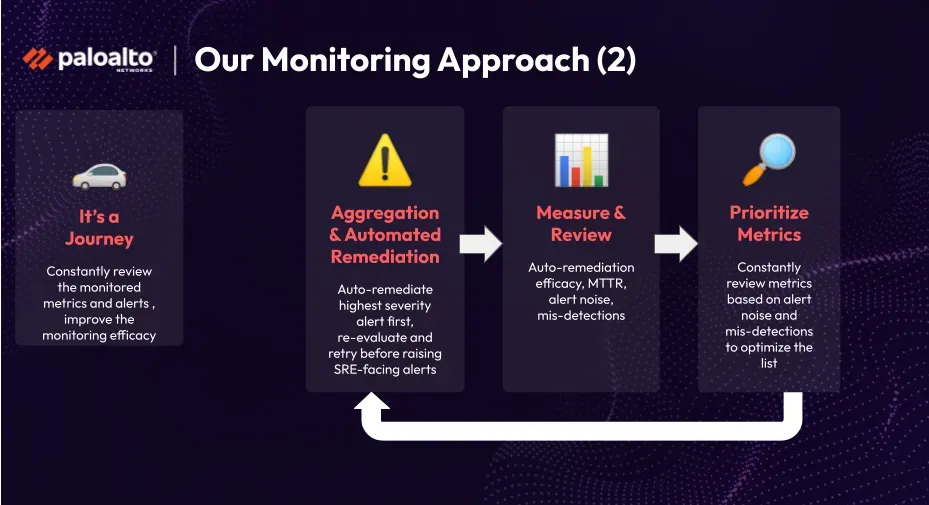
The journey of refining their monitoring approach is an ongoing process for the team. Despite initially identifying key issues related to customer experience, they continue to discover new metrics and potential sources of noise. To address this, they employ aggregation and automated remediation while constantly measuring the effectiveness of auto-remediation through metrics such as MTTR (Mean Time to Resolution), noise reduction, and manual analysis of missed detections. This input allows them to prioritize and revisit metrics, ensuring that their monitoring solution evolves to address both noise and missing elements effectively.
Part 3: Using Metrics in an Autonomous System

Sedai’s Unique Challenges

  • Multiple Monitoring Providers: Sedai works with various monitoring providers, each with its own data format and structure. This makes it difficult to unify and standardize the data, requiring normalization to ensure consistent analysis and effective decision-making.
  • Multiple Resource Types: Sedai manages diverse resources, including VMs, serverless functions, K8s clusters, and various storage and databases. Each resource type requires specialized monitoring and management techniques, adding complexity to data management, extraction, and resource optimization.
  • Real-time Data Stress and Predictive Analytics: Sedai focuses on real-time prediction and immediate action based on incoming metrics. This places a strain on data processing and analysis, demanding efficient systems to handle the continuous data stream. Additionally, Sedai utilizes predictive analytics to anticipate issues or trends, enabling proactive actions.
  • Sedai aims to overcome these challenges by creating a flexible and adaptive system. The goal is to operate effectively in diverse environments, provide accurate insights across multiple monitoring providers, efficiently manage different resource types, and enable real-time prediction and decision-making capabilities.

Data Hierarchy in an Autonomous System

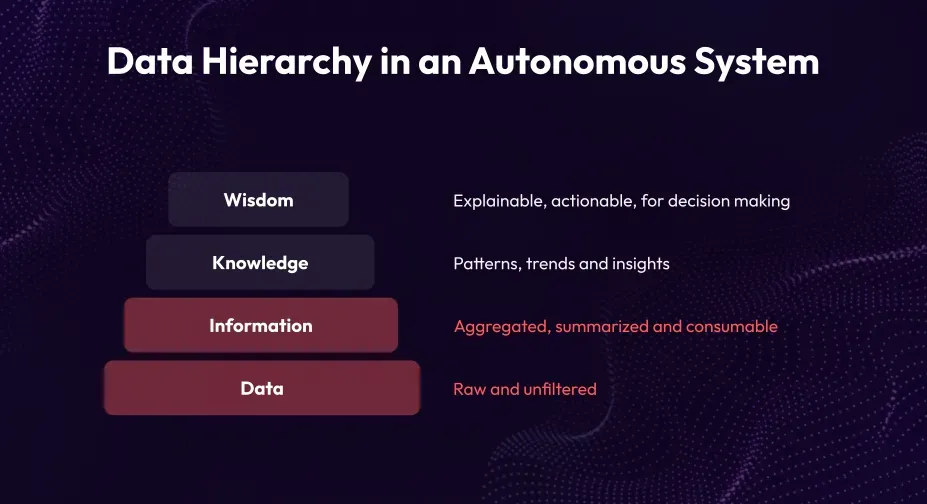
In the data hierarchy of an autonomous system, raw unfiltered data is collected from various monitoring systems. This data is then aggregated and summarized to make it more consumable and meaningful. The next level involves extracting patterns, trends, and insights, providing knowledge from the data. With accumulated knowledge, decisions can be made, changes can be implemented, and actions can be taken. This is where metrics prioritization and decision-making occur within the hierarchy.
Classification of Metrics

We had different ways of classifying metrics. Golden signals, defined by Google, are  the standard in many organizations across industries. There are also other methods like the Use method, RED method, VALET, which again, came from Google. These are different ways to look at your metrics and classify them. What we realized is none of this actually fits our mental model and how we wanted to approach metrics and use that for prioritization.

Classification of metrics

  • Golden Signals - Tracking end user performance and outward facing and latency traffic, errors, and Saturation
  • Use Method - Focused on infrastructure and outward facing. Utilization,Saturation and Errors
  • RED Method -Focus on microservices architecture. Rate, Errors, Duration
  • VALET - For SLO based monitoring. Volume, Availability,Latency, Errors and Tickets

Three Categories of Metrics

We have developed a unique approach to categorizing metrics, inspired by data science and machine learning practices. Our categorization involves three types of metrics: input metrics, secondary metrics, and primary metrics.

Input metrics: Independent metrics, originates from outside the system

  • Volume, traffic, network in - bytes, external messages or events, uploaded the file size
  • Mostly Traffic metrics

Secondary Metrics: Hidden variables that link Input and Primary metrics.

  • Most of the other metrics fail in this category
  • Mostly Saturation metrics ( although same times they are also primary metrics)

Primary Metrics: Dependent metrics that we want to act on.

  • Timeouts, throttles, 404s, 500s, latency, errors, disconnects, etc
  • Mostly latency and Errors metrics

Correlation Chain

Within the correlation chain, input metrics have an influence on secondary metrics, which subsequently affect the primary metrics. However, it is important to note that the time it takes for an input metric to impact the primary metrics can vary. The key realization is that the correlation between these metrics involves a time delay. While there is a relationship between them, there is a temporal gap involved. The challenge lies in identifying and comprehending the correlation between metrics considering these time shifts.

Here is the summary

  1. Variation in Input metrics causes variations in secondary metrics
  2. Variations in secondary metrics impacts Primary metrics
  3. How long does input metrics take to impact primary metrics
  4. Key Insight : Correlation between metrics are time shifted
  5. Find correlation between metrics with time-shift. 

Sedai's Approach

Sedai's approach involves using machine learning to automatically categorize metrics as primary, secondary, or input. We preprocess the metrics by removing static, non-linear, and noisy data, focusing on meaningful information. Next, we perform correlation analysis with time shifts across metric combinations. The metrics are ranked and assigned correlation scores, and reinforcement learning techniques are applied to continuously improve metric prioritization. The outcome is a curated list of key metrics that depict input metrics, behavior, primary metrics, and their relationships. This approach helps uncover hidden variables and correlations, resulting in a more manageable and finite set of metrics for analysis.

Before and After Timestamps and Time Shift Alignment

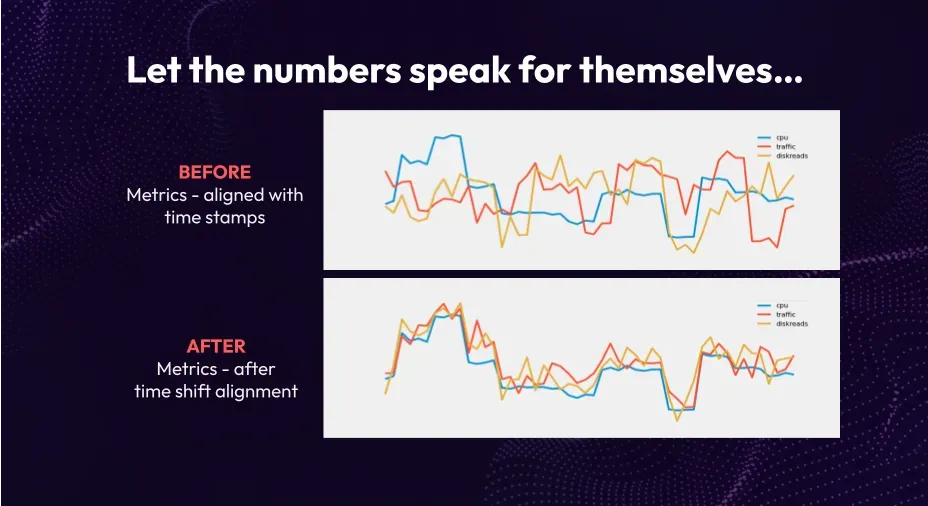
This example demonstrates the correlation between traffic, CPU usage, and discreets. By employing time shifting and aligning the data, we unveil patterns that would otherwise be difficult to discern. The aligned data reveals that traffic serves as a predictive metric for discreets, which in turn predicts CPU performance. Therefore, if your input metric is traffic and CPU saturation is of interest, this analysis highlights the hidden variable that connects them. Such correlation analysis allows us to identify meaningful links between metrics and streamline our focus to a manageable and finite set.
Our Outcome

Our approach has yielded impressive results, as we have found that a significant portion of the metrics, approximately 90%, were unnecessary or unhelpful in providing meaningful insights. Instead, the valuable signals that contribute to our analysis and predictions are concentrated in just about 3% of the metrics. It's important to note that this percentage is not fixed, as we continually assess and refine each metric to identify those that are truly relevant.

By following this iterative process, we are able to achieve accurate predictions, improve availability, optimize resource allocation, and enhance the overall signal-to-noise ratio. Additionally, our approach empowers us to effectively handle larger volumes of metrics and successfully scale our platform to meet growing demands.

Was this content helpful?

Thank you for submitting your feedback.
Oops! Something went wrong while submitting the form.

CONTENTS

Autonomous Builds on Observability: Picking the right metrics

Published on
Last updated on

August 9, 2024

Max 3 min
Autonomous Builds on Observability: Picking the right metrics

Note: this blog is based on a talk given by Nikhil Gopinath of Sedai and Tsahi Peleg of Palo Alto Networks at autocon/22.

Introduction

In the field of engineering, there's a widely recognized principle: "You can only manage things that you can measure." This principle highlights the importance of having measurable data to effectively monitor and manage your system. However, as with many good things, there can be too much of it. That leads us to the question: How much data is too much, and what issues can arise from an excessive abundance of metrics?

In our discussion, we will explore the potential problems associated with an overwhelming influx of data and metrics. We'll touch upon the delicate balance between gathering enough information to make informed decisions and drowning in a sea of superfluous data. Tsahi Peleg of Palo Alto Networks will then provide us with valuable insights into how Palo Alto Networks has successfully tackled this issue.

Furthermore, I'll be sharing Sedai's approach to metrics prioritization, which offers a tailored and scalable solution. I'm excited to walk you through the steps we've taken to ensure that our clients can focus on the metrics that align with their specific needs. You can watch the original video here.

What is Autonomous Cloud Management

Autonomous Cloud Management, exemplified by Sedai, is a platform that autonomously oversees and optimizes your cloud infrastructure, applications, and microservices. By leveraging observability platforms like Cloudwatch, Prometheus, and Datadog, Sedai utilizes metrics, including system metrics, application metrics, topology information, and tickets, to ensure availability and optimization.

Sedai’s Architecture

Sedai's architecture incorporates APMs, monitoring systems (e.g., Datadog, New Relic), and notification providers (e.g., Slack, PagerDuty) on the left side. It integrates with ticketing systems (e.g., BMC, Jira, ServiceNow), cloud providers, and automation systems (e.g., Stack Stone, Rundeck). This setup enables Sedai to gather detailed information, push/pull notifications, and utilize data from various sources, including cloud providers. The architecture reflects the scale and complexity of the challenges Sedai typically handles.

Part 1: Metrics Overload

Let's talk about the problem of metrics overload, namely having too many metrics. 

There are four common causes:

Cause 1: APMs/monitoring providers generate a lot of data

APMs and monitoring providers generate abundant data. Analyzing and utilizing this data for models, analytics, and predictions pose challenges due to the vast number of metrics involved. For instance, a single monitored application can produce over 135 metrics. When dealing with numerous serverless applications in a system, the metric count exponentially multiplies.

Cause 2: Majority of data redundant, irrelevant and noisy

The majority of data generated by APMs and monitoring providers is often redundant, irrelevant, and noisy. Much of this data lacks correlation with other metrics, making it individually useful but not necessarily relevant to specific problem identification or prevention. On the other hand, many metrics exhibit direct correlation, leading to potential redundancy and duplication of information. Additionally, signals can be noisy due to factors such as sensor tuning or inherent system noise. Consequently, some data may lack value and fail to provide predictive insights.

Cause 3: Not all metrics identify the root cause

As the number of metrics grows, it becomes challenging to determine the root cause of issues. Identifying the specific metric that triggered a change or caused an outage requires stepping back in time. With an increasing number of metrics, conducting root cause analysis becomes more difficult, making it harder to pinpoint the fundamental factor behind system problems or outages.

Cause 4: Not all metrics have predictive power

With a temporal perspective, determining which metrics could have predicted an issue becomes a complex task. Predicting future outcomes and understanding the downstream impacts of metrics becomes increasingly challenging as the number of metrics increases. Hence, prioritizing metrics becomes crucial in addressing the challenges associated with the volume of metrics.

Part 2: Palo AltoNetwork’s Approach to Choosing Observability Metrics

Palo Alto Networks: Overview

Palo Alto Networks is a leading global cyber security vendor specializing in various fields like network security, automation of security, operations center, cloud security, and also a security research unit. They develop every part of the security solution as a platform, hoping to be partners for managing the security challenges of different enterprises.

SASE is one of the solutions that they are providing to customers in the last few years. It's actually a revolutionary approach to be as tuned as it should be, or there is inherent noise in the system. There is data that inherently has enterprise networking. It's a new model for enterprise networking, which grew significantly in the last few years because of the increase in remote workers and also in cloud based applications.

The concept is to provide enterprise network and security as a cloud-based service. Palo Alto  Networks runs firewalls, routers, and other network/security appliances in their cloud, enabling end users to connect to their enterprise network and applications from various locations. The challenge lies in monitoring the solution's operational status and reducing excessive noise caused by an overwhelming number of emitted metrics.

Our Monitoring Challenge

The solution comprises several components: SD-WAN routers and firewalls running as VMs in the cloud, interconnected through IPSec tunnels to form the enterprise network. A K8S-based control plane and Data Analytics Platform oversee the entire networking solution, while a serverless control plane manages policy orchestration for the firewalls and SD-WAN routers. Each component generates numerous metrics for our monitoring solutions, including DataDog, Google Cloud Monitoring, and Influx TICK stack. However, determining the relevant metrics poses a challenge. It is crucial to identify metrics that truly indicate significant issues rather than getting overwhelmed by noise. Simply monitoring all metrics and setting threshold-based alerts can lead to difficulties in pinpointing the root causes of real problems amidst the noise.

To monitor the system effectively, focus is placed on key metrics known as "golden metrics." In the case of firewalls, four categories of golden metrics are considered. These include throughput metrics, which encompass configuration changes and actual traffic throughput. Error metrics track API errors and logged errors in firewall logs. Latency metrics cover security processing, network latency, and API/config latency. Saturation metrics include CPU and memory usage. While around 100 metrics are emitted by the firewalls, setting alerts based on thresholds for all of them can lead to excessive noise.

Monitoring Approach

To create a monitoring solution that avoids excessive noise, several steps were implemented. Initially, all metrics were collected and made accessible through platforms like Google Data Studio or Grafana. Noise was filtered out by excluding errors that didn't indicate real issues, such as user validation errors. Critical service connectivity errors were prioritized for generating alerts. Alerts were then aggregated per resource, such as firewalls, and prioritized based on severity. Auto-remediation was attempted for certain issues, such as resetting caches or configurations and restarting services. Only alerts that couldn't be remediated were escalated to the SRE team. By following these steps of aggregation, analysis, and auto-remediation, noise was effectively reduced for the SRE team.

The journey of refining their monitoring approach is an ongoing process for the team. Despite initially identifying key issues related to customer experience, they continue to discover new metrics and potential sources of noise. To address this, they employ aggregation and automated remediation while constantly measuring the effectiveness of auto-remediation through metrics such as MTTR (Mean Time to Resolution), noise reduction, and manual analysis of missed detections. This input allows them to prioritize and revisit metrics, ensuring that their monitoring solution evolves to address both noise and missing elements effectively.

Part 3: Using Metrics in an Autonomous System

Sedai’s Unique Challenges

  • Multiple Monitoring Providers: Sedai works with various monitoring providers, each with its own data format and structure. This makes it difficult to unify and standardize the data, requiring normalization to ensure consistent analysis and effective decision-making.
  • Multiple Resource Types: Sedai manages diverse resources, including VMs, serverless functions, K8s clusters, and various storage and databases. Each resource type requires specialized monitoring and management techniques, adding complexity to data management, extraction, and resource optimization.
  • Real-time Data Stress and Predictive Analytics: Sedai focuses on real-time prediction and immediate action based on incoming metrics. This places a strain on data processing and analysis, demanding efficient systems to handle the continuous data stream. Additionally, Sedai utilizes predictive analytics to anticipate issues or trends, enabling proactive actions.
  • Sedai aims to overcome these challenges by creating a flexible and adaptive system. The goal is to operate effectively in diverse environments, provide accurate insights across multiple monitoring providers, efficiently manage different resource types, and enable real-time prediction and decision-making capabilities.

Data Hierarchy in an Autonomous System

In the data hierarchy of an autonomous system, raw unfiltered data is collected from various monitoring systems. This data is then aggregated and summarized to make it more consumable and meaningful. The next level involves extracting patterns, trends, and insights, providing knowledge from the data. With accumulated knowledge, decisions can be made, changes can be implemented, and actions can be taken. This is where metrics prioritization and decision-making occur within the hierarchy.

Classification of Metrics

We had different ways of classifying metrics. Golden signals, defined by Google, are  the standard in many organizations across industries. There are also other methods like the Use method, RED method, VALET, which again, came from Google. These are different ways to look at your metrics and classify them. What we realized is none of this actually fits our mental model and how we wanted to approach metrics and use that for prioritization.

Classification of metrics

  • Golden Signals - Tracking end user performance and outward facing and latency traffic, errors, and Saturation
  • Use Method - Focused on infrastructure and outward facing. Utilization,Saturation and Errors
  • RED Method -Focus on microservices architecture. Rate, Errors, Duration
  • VALET - For SLO based monitoring. Volume, Availability,Latency, Errors and Tickets

Three Categories of Metrics

We have developed a unique approach to categorizing metrics, inspired by data science and machine learning practices. Our categorization involves three types of metrics: input metrics, secondary metrics, and primary metrics.

Input metrics: Independent metrics, originates from outside the system

  • Volume, traffic, network in - bytes, external messages or events, uploaded the file size
  • Mostly Traffic metrics

Secondary Metrics: Hidden variables that link Input and Primary metrics.

  • Most of the other metrics fail in this category
  • Mostly Saturation metrics ( although same times they are also primary metrics)

Primary Metrics: Dependent metrics that we want to act on.

  • Timeouts, throttles, 404s, 500s, latency, errors, disconnects, etc
  • Mostly latency and Errors metrics

Correlation Chain

Within the correlation chain, input metrics have an influence on secondary metrics, which subsequently affect the primary metrics. However, it is important to note that the time it takes for an input metric to impact the primary metrics can vary. The key realization is that the correlation between these metrics involves a time delay. While there is a relationship between them, there is a temporal gap involved. The challenge lies in identifying and comprehending the correlation between metrics considering these time shifts.

Here is the summary

  1. Variation in Input metrics causes variations in secondary metrics
  2. Variations in secondary metrics impacts Primary metrics
  3. How long does input metrics take to impact primary metrics
  4. Key Insight : Correlation between metrics are time shifted
  5. Find correlation between metrics with time-shift. 

Sedai's Approach

Sedai's approach involves using machine learning to automatically categorize metrics as primary, secondary, or input. We preprocess the metrics by removing static, non-linear, and noisy data, focusing on meaningful information. Next, we perform correlation analysis with time shifts across metric combinations. The metrics are ranked and assigned correlation scores, and reinforcement learning techniques are applied to continuously improve metric prioritization. The outcome is a curated list of key metrics that depict input metrics, behavior, primary metrics, and their relationships. This approach helps uncover hidden variables and correlations, resulting in a more manageable and finite set of metrics for analysis.

Before and After Timestamps and Time Shift Alignment

This example demonstrates the correlation between traffic, CPU usage, and discreets. By employing time shifting and aligning the data, we unveil patterns that would otherwise be difficult to discern. The aligned data reveals that traffic serves as a predictive metric for discreets, which in turn predicts CPU performance. Therefore, if your input metric is traffic and CPU saturation is of interest, this analysis highlights the hidden variable that connects them. Such correlation analysis allows us to identify meaningful links between metrics and streamline our focus to a manageable and finite set.

Our Outcome

Our approach has yielded impressive results, as we have found that a significant portion of the metrics, approximately 90%, were unnecessary or unhelpful in providing meaningful insights. Instead, the valuable signals that contribute to our analysis and predictions are concentrated in just about 3% of the metrics. It's important to note that this percentage is not fixed, as we continually assess and refine each metric to identify those that are truly relevant.

By following this iterative process, we are able to achieve accurate predictions, improve availability, optimize resource allocation, and enhance the overall signal-to-noise ratio. Additionally, our approach empowers us to effectively handle larger volumes of metrics and successfully scale our platform to meet growing demands.

Was this content helpful?

Thank you for submitting your feedback.
Oops! Something went wrong while submitting the form.